29
/
en
AIzaSyAYiBZKx7MnpbEhh9jyipgxe19OcubqV5w
April 1, 2024
31711
Europe & Central Asia (excluding high income)
ECA
false
2
1
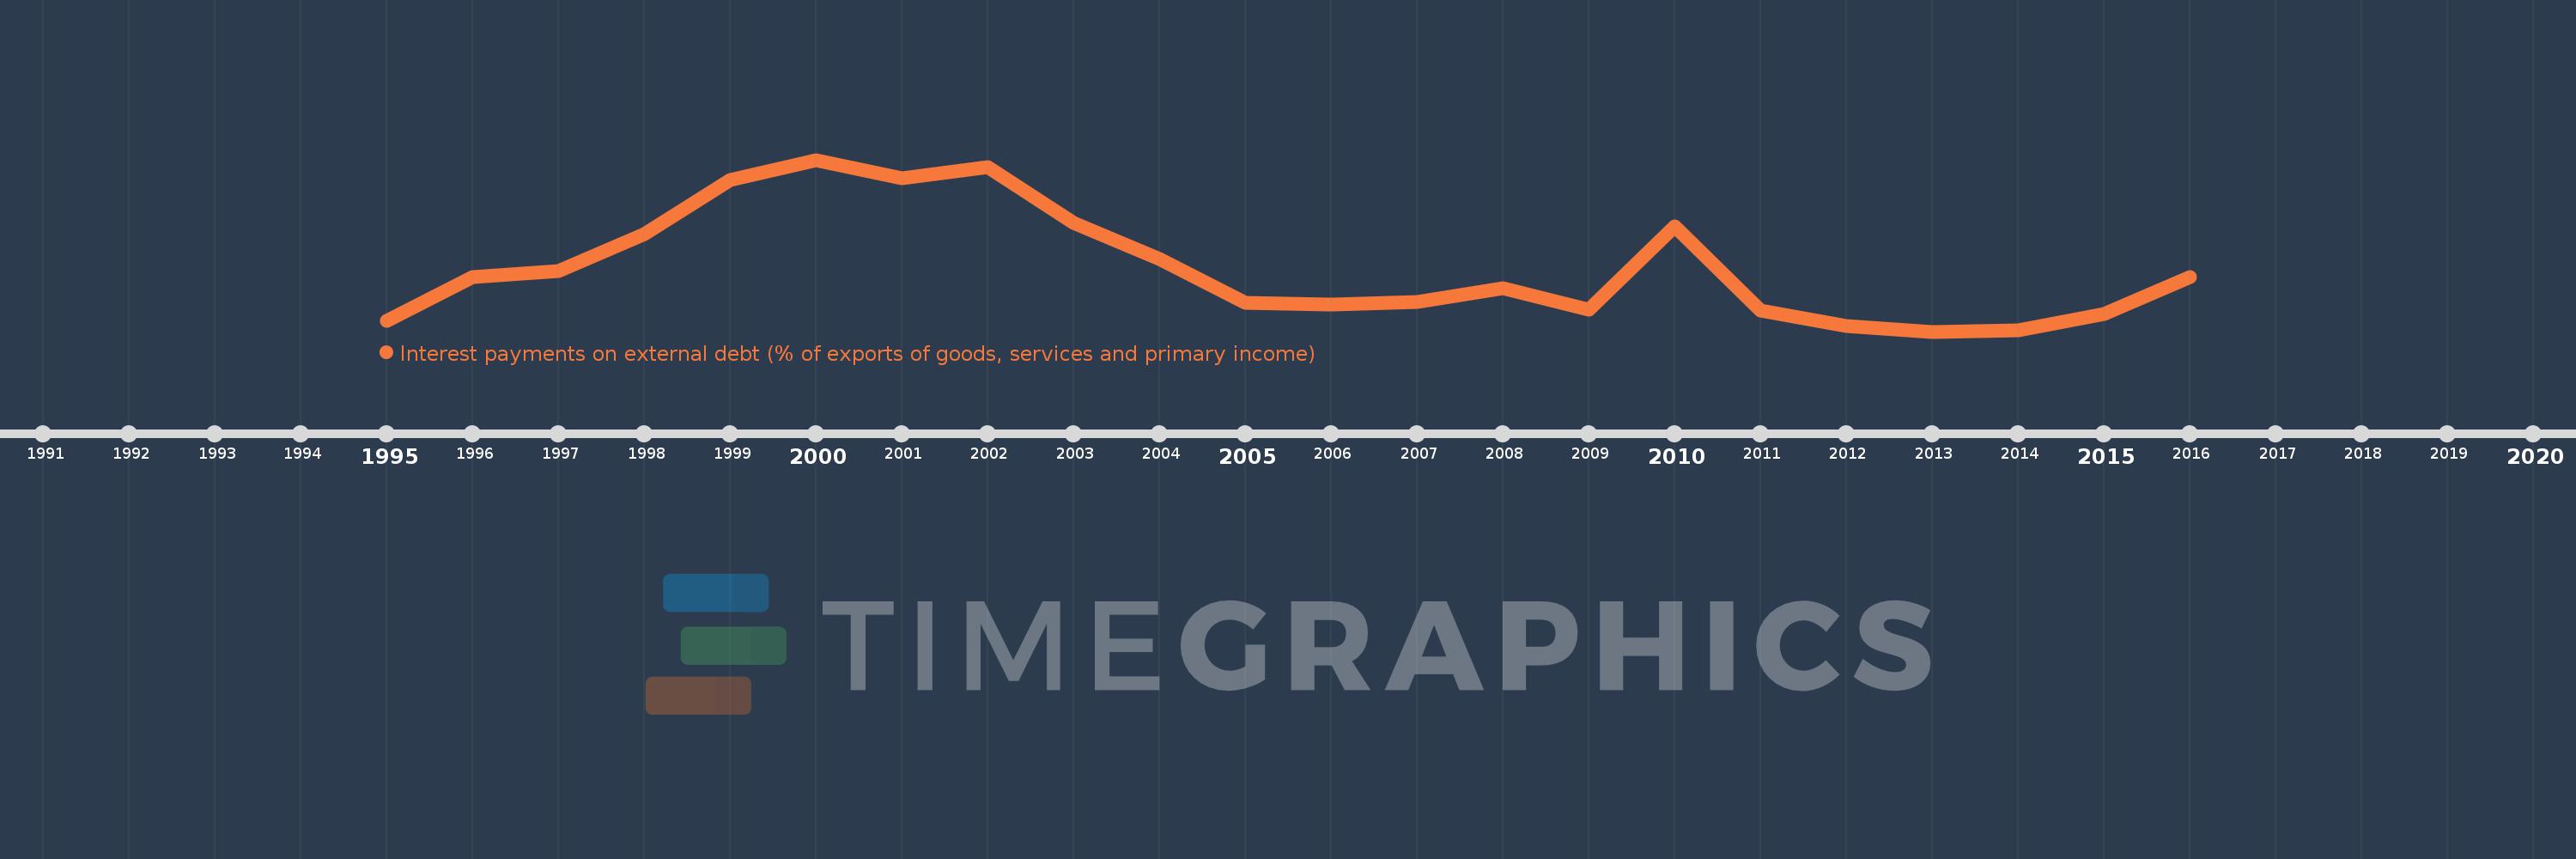
Interest payments on external debt (% of exports of goods, services and primary income)
2016,2015,2014,2013,2012,2011,2010,2009,2008,2007,2006,2005,2004,2003,2002,2001,2000,1999,1998,1997,1996,1995
This statistics in other country:
Timeline:
This timeline shows a graph from 1995 to 2016 of Europe & Central Asia (excluding high income). No data until 1994. Number of actual observations by date: 22.
Source name:
World Development Indicators
Source organization:
World Bank, International Debt Statistics.
Categories, topics:
Economy & Growth, External Debt
Last updated:
apr 23, 2017
Indicators value changes by year
At the date of observation
Value
Absolute change
Change from previous value
jan 1, 1996
4.689
+0.888
23.38%
jan 1, 1997
4.798
+0.109
2.33%
jan 1, 1998
5.548
+0.751
15.64%
jan 1, 1999
6.624
+1.075
19.38%
jan 1, 2000
7.033
+0.409
6.17%
jan 1, 2001
6.661
-0.372
-5.29%
jan 1, 2002
6.895
+0.235
3.52%
jan 1, 2003
5.765
-1.131
-16.4%
jan 1, 2004
5.04
-0.724
-12.56%
jan 1, 2005
4.17
-0.87
-17.26%
jan 1, 2006
4.127
-0.043
-1.04%
jan 1, 2007
4.182
+0.055
1.33%
jan 1, 2008
4.45
+0.268
6.4%
jan 1, 2009
4.032
-0.418
-9.4%
jan 1, 2010
5.705
+1.674
41.52%
jan 1, 2011
4.002
-1.704
-29.86%
jan 1, 2012
3.693
-0.309
-7.72%
jan 1, 2013
3.588
-0.105
-2.85%
jan 1, 2014
3.621
+0.033
0.93%
jan 1, 2015
3.943
+0.322
8.9%
jan 1, 2016
4.688
+0.745
18.9%
Ranking of countries by current statistics by years


Comments: