29
/
en
AIzaSyAYiBZKx7MnpbEhh9jyipgxe19OcubqV5w
April 1, 2024
67905
Angola
AGO
true
2
1
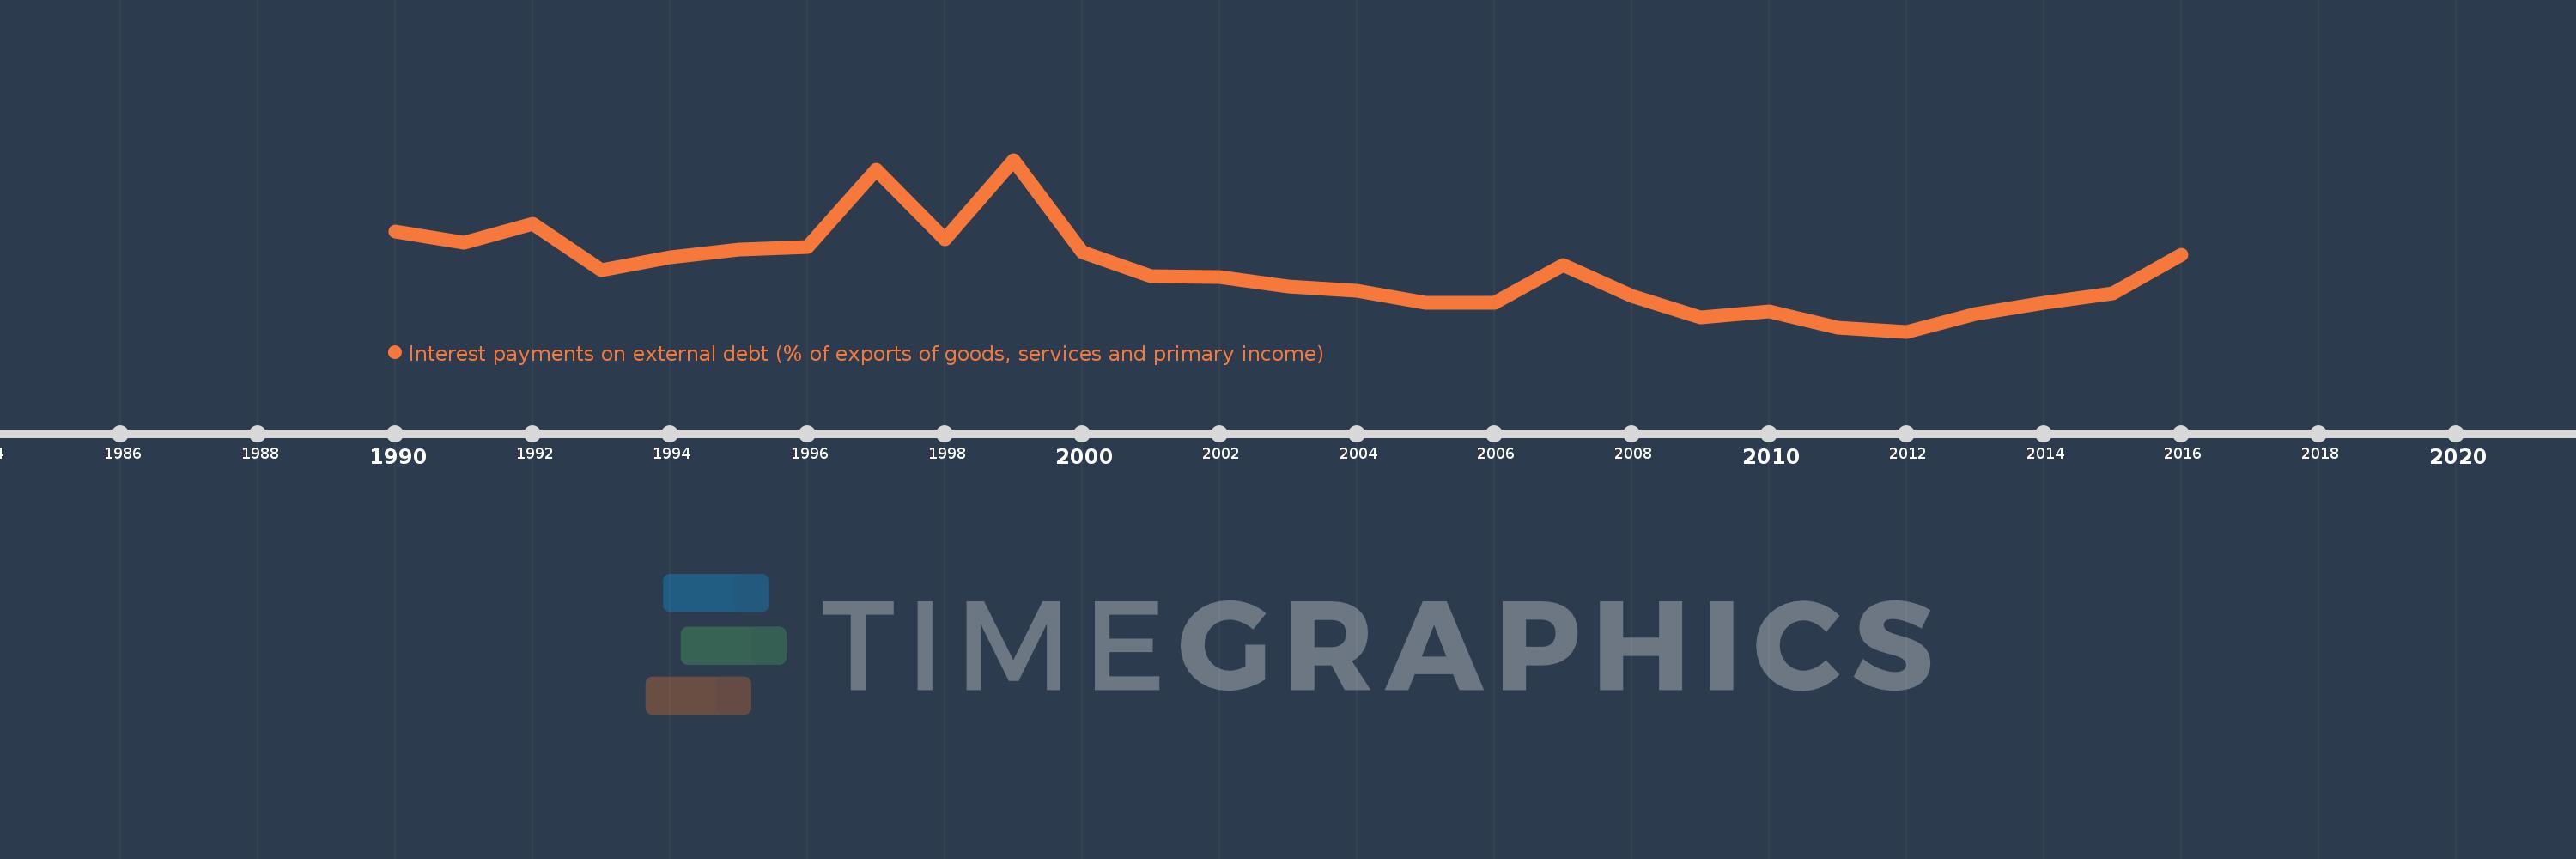
Interest payments on external debt (% of exports of goods, services and primary income)
2016,2015,2014,2013,2012,2011,2010,2009,2008,2007,2006,2005,2004,2003,2002,2001,2000,1999,1998,1997,1996,1995,1994,1993,1992,1991,1990
This statistics in other country:
Timeline:
This timeline shows a graph from 1990 to 2016 of Angola. No data until 1989. Number of actual observations by date: 27.
Source name:
World Development Indicators
Source organization:
World Bank, International Debt Statistics.
Categories, topics:
Economy & Growth, External Debt
Last updated:
apr 23, 2017
Indicators value changes by year
At the date of observation
Value
Absolute change
Change from previous value
jan 1, 1990
3.99
+3.99
0.0%
jan 1, 1991
3.58
-0.41
-10.28%
jan 1, 1992
4.287
+0.707
19.75%
jan 1, 1993
2.542
-1.745
-40.71%
jan 1, 1994
3.038
+0.496
19.53%
jan 1, 1995
3.328
+0.29
9.56%
jan 1, 1996
3.437
+0.108
3.25%
jan 1, 1997
6.326
+2.889
84.07%
jan 1, 1998
3.7
-2.626
-41.51%
jan 1, 1999
6.69
+2.99
80.79%
jan 1, 2000
3.238
-3.452
-51.6%
jan 1, 2001
2.32
-0.918
-28.36%
jan 1, 2002
2.295
-0.025
-1.1%
jan 1, 2003
1.933
-0.362
-15.77%
jan 1, 2004
1.77
-0.163
-8.43%
jan 1, 2005
1.326
-0.444
-25.07%
jan 1, 2006
1.339
+0.013
0.97%
jan 1, 2007
2.747
+1.409
105.2%
jan 1, 2008
1.57
-1.178
-42.87%
jan 1, 2009
0.776
-0.794
-50.59%
jan 1, 2010
1.019
+0.243
31.33%
jan 1, 2011
0.389
-0.629
-61.79%
jan 1, 2012
0.249
-0.141
-36.14%
jan 1, 2013
0.907
+0.658
264.75%
jan 1, 2014
1.326
+0.42
46.29%
jan 1, 2015
1.675
+0.349
26.29%
jan 1, 2016
3.127
+1.453
86.74%
Ranking of countries by current statistics by years


Comments: