29
/
en
AIzaSyAYiBZKx7MnpbEhh9jyipgxe19OcubqV5w
April 1, 2024
49124
Middle East & North Africa (excluding high income)
MNA
false
2
1
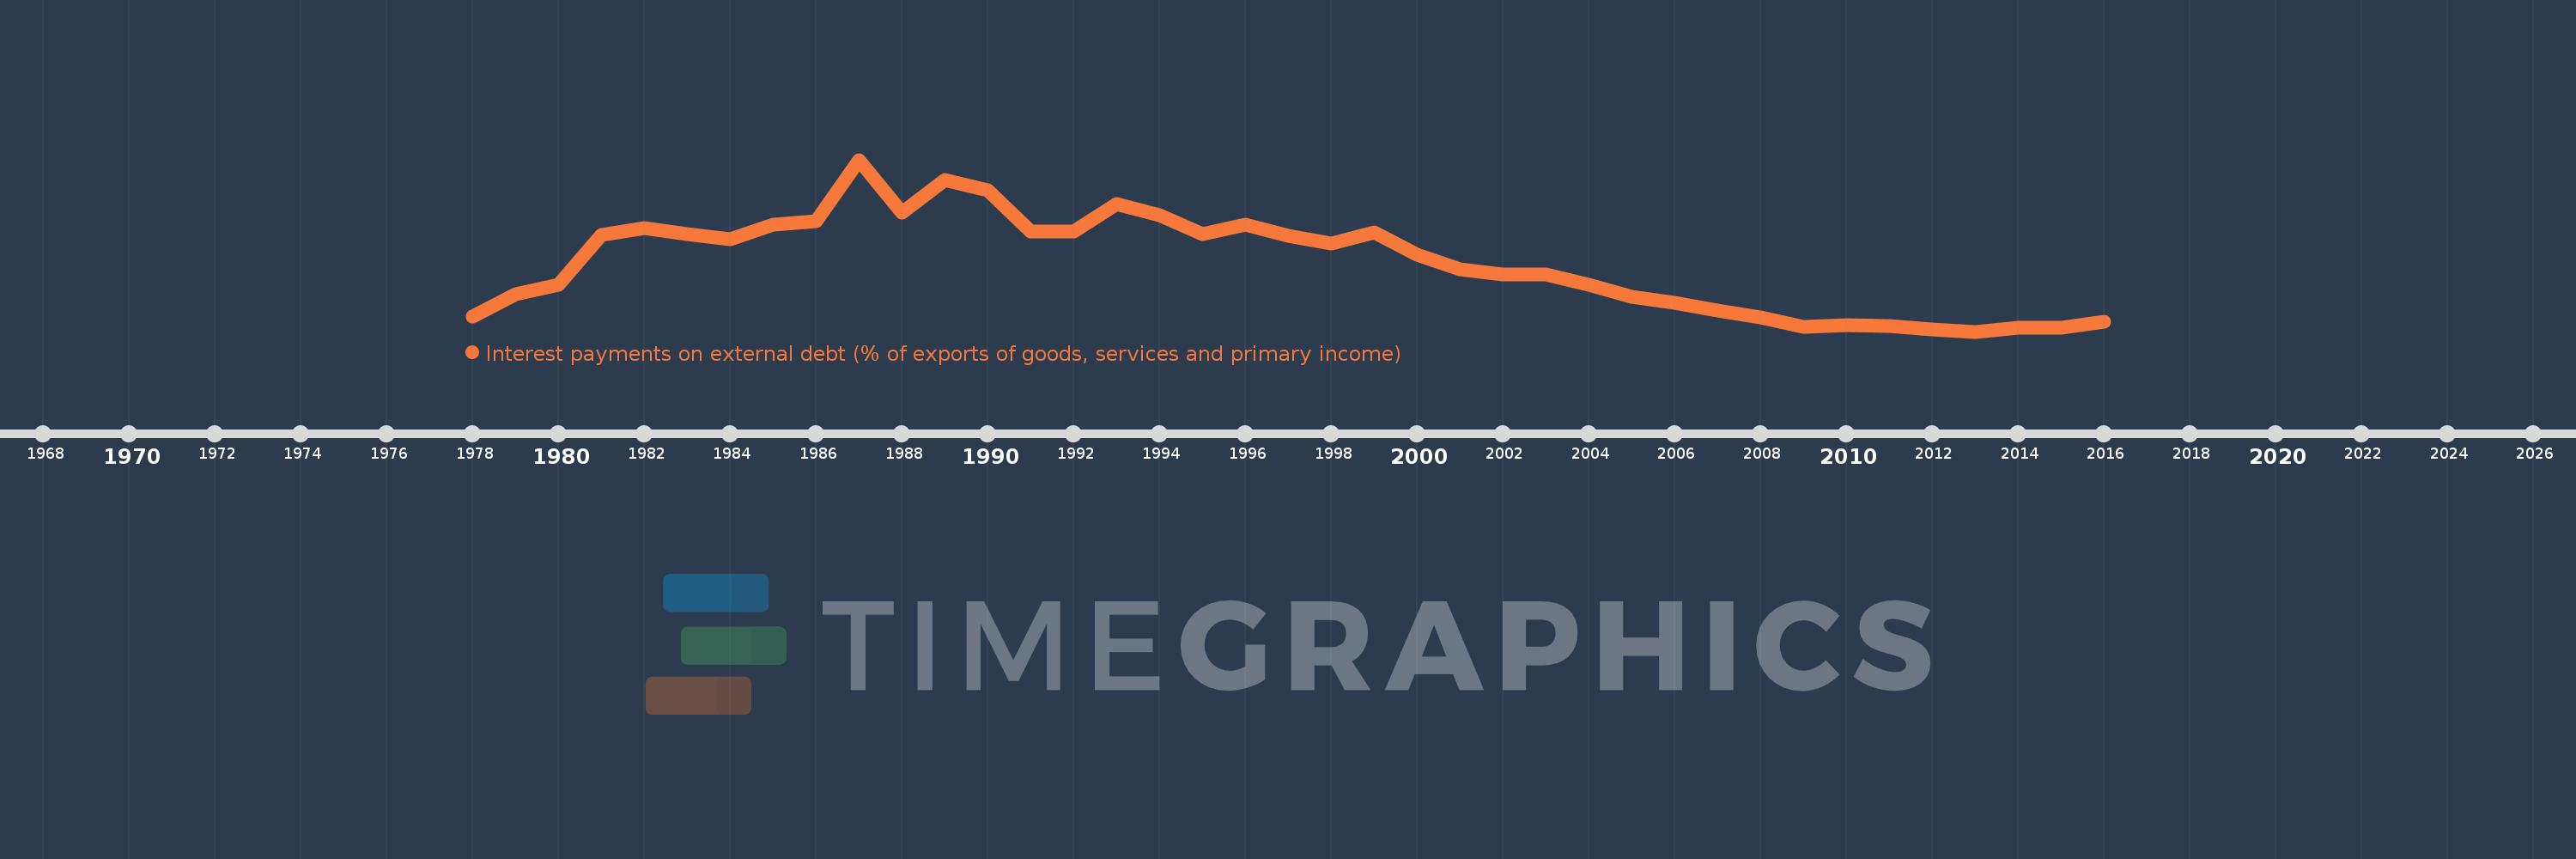
Interest payments on external debt (% of exports of goods, services and primary income)
2016,2015,2014,2013,2012,2011,2010,2009,2008,2007,2006,2005,2004,2003,2002,2001,2000,1999,1998,1997,1996,1995,1994,1993,1992,1991,1990,1989,1988,1987,1986,1985,1984,1983,1982,1981,1980,1979,1978
This statistics in other country:
Timeline:
This timeline shows a graph from 1978 to 2016 of Middle East & North Africa (excluding high income). No data until 1977. Number of actual observations by date: 39.
Source name:
World Development Indicators
Source organization:
World Bank, International Debt Statistics.
Categories, topics:
Economy & Growth, External Debt
Last updated:
apr 23, 2017
Indicators value changes by year
At the date of observation
Value
Absolute change
Change from previous value
jan 1, 1978
2.116
+2.116
0.0%
jan 1, 1979
3.598
+1.481
70.0%
jan 1, 1980
4.213
+0.615
17.1%
jan 1, 1981
7.475
+3.262
77.43%
jan 1, 1982
7.924
+0.449
6.0%
jan 1, 1983
7.564
-0.36
-4.55%
jan 1, 1984
7.226
-0.337
-4.46%
jan 1, 1985
8.185
+0.958
13.26%
jan 1, 1986
8.386
+0.201
2.46%
jan 1, 1987
12.44
+4.054
48.35%
jan 1, 1988
8.94
-3.501
-28.14%
jan 1, 1989
11.11
+2.17
24.28%
jan 1, 1990
10.419
-0.692
-6.22%
jan 1, 1991
7.717
-2.702
-25.94%
jan 1, 1992
7.703
-0.014
-0.18%
jan 1, 1993
9.553
+1.85
24.02%
jan 1, 1994
8.785
-0.768
-8.04%
jan 1, 1995
7.551
-1.234
-14.05%
jan 1, 1996
8.18
+0.629
8.33%
jan 1, 1997
7.435
-0.746
-9.12%
jan 1, 1998
6.913
-0.521
-7.01%
jan 1, 1999
7.654
+0.741
10.72%
jan 1, 2000
6.173
-1.481
-19.35%
jan 1, 2001
5.215
-0.958
-15.52%
jan 1, 2002
4.88
-0.336
-6.44%
jan 1, 2003
4.907
+0.027
0.56%
jan 1, 2004
4.241
-0.665
-13.56%
jan 1, 2005
3.416
-0.825
-19.45%
jan 1, 2006
3.016
-0.401
-11.73%
jan 1, 2007
2.538
-0.478
-15.84%
jan 1, 2008
2.082
-0.456
-17.96%
jan 1, 2009
1.465
-0.617
-29.64%
jan 1, 2010
1.561
+0.096
6.56%
jan 1, 2011
1.481
-0.08
-5.12%
jan 1, 2012
1.266
-0.215
-14.52%
jan 1, 2013
1.142
-0.124
-9.81%
jan 1, 2014
1.407
+0.265
23.19%
jan 1, 2015
1.4
-0.007
-0.5%
jan 1, 2016
1.795
+0.395
28.23%
Ranking of countries by current statistics by years


Comments: