29
/
en
AIzaSyAYiBZKx7MnpbEhh9jyipgxe19OcubqV5w
April 1, 2024
197724
Moldova
MDA
true
2
1
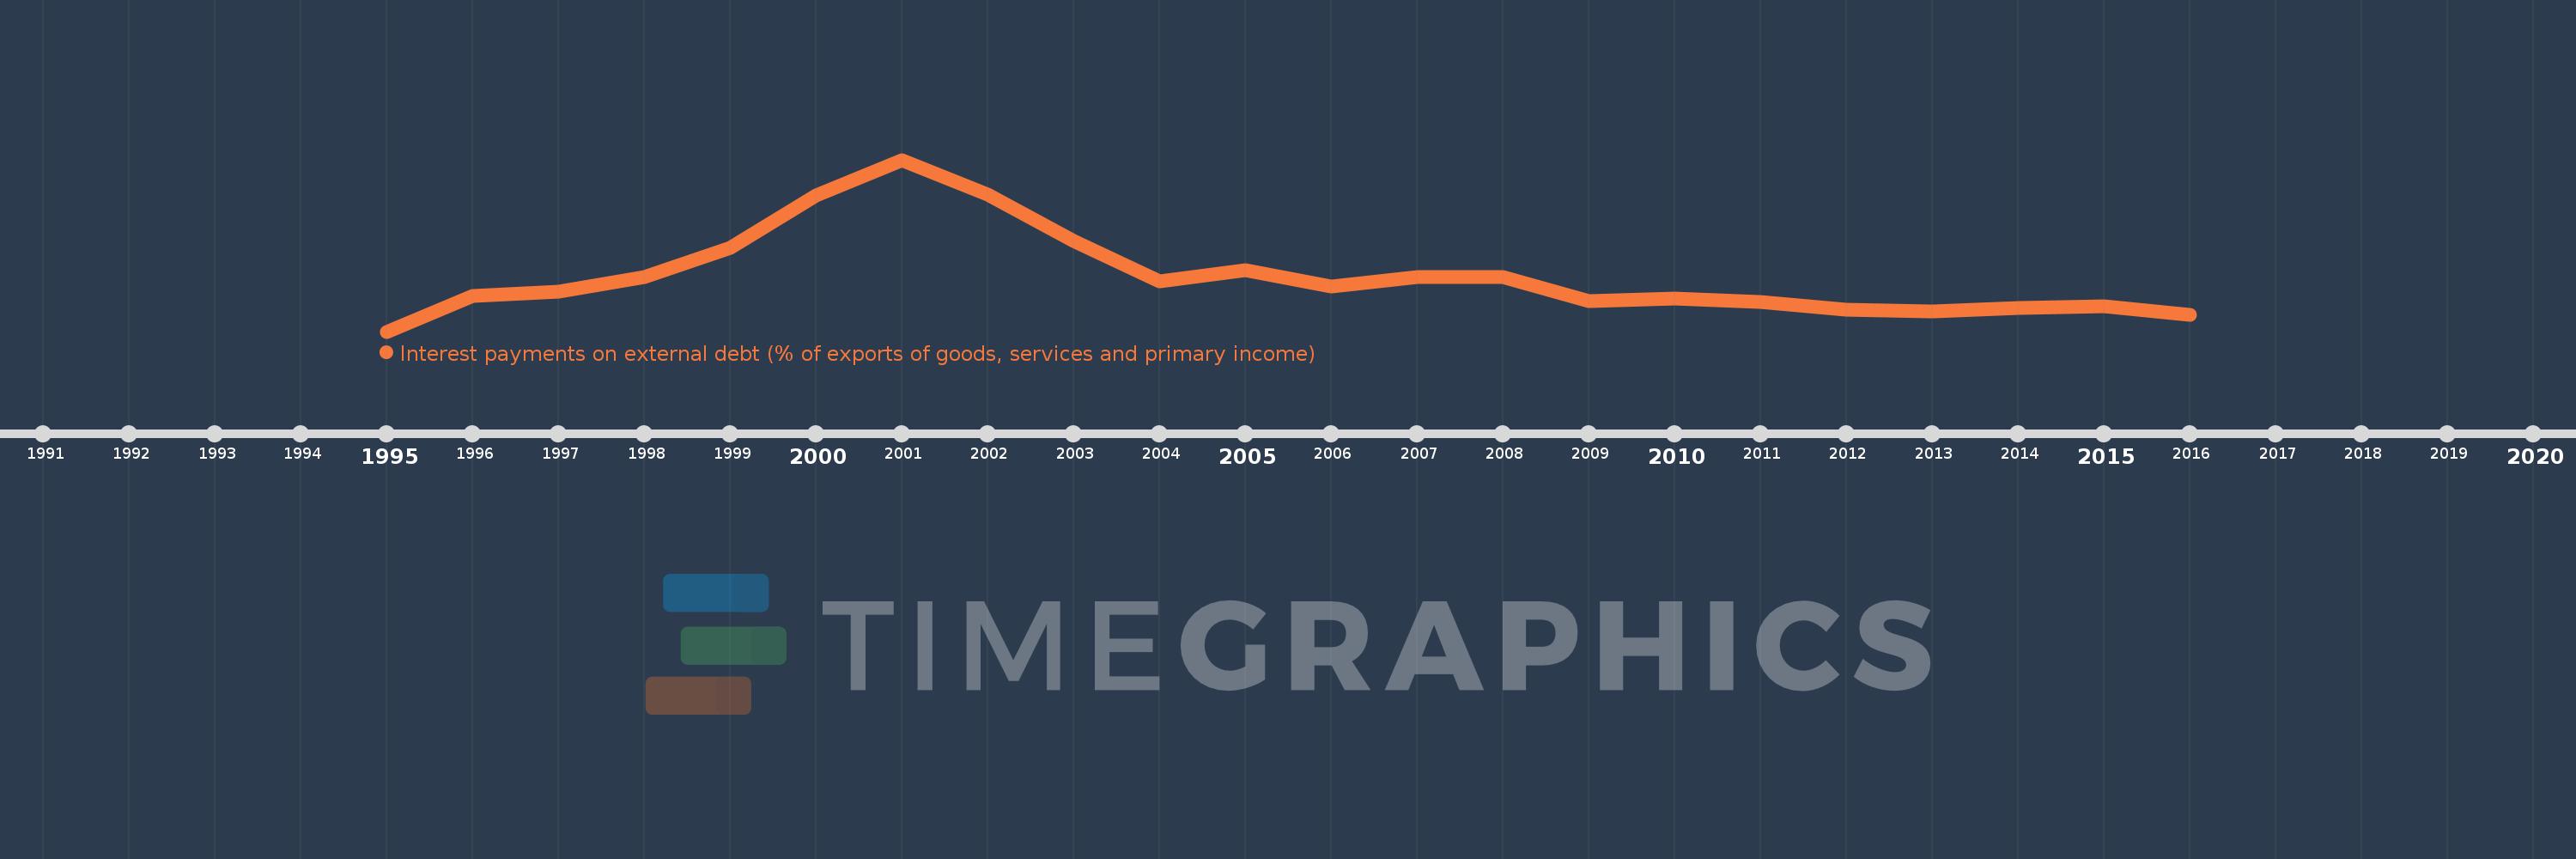
Interest payments on external debt (% of exports of goods, services and primary income)
2016,2015,2014,2013,2012,2011,2010,2009,2008,2007,2006,2005,2004,2003,2002,2001,2000,1999,1998,1997,1996,1995
This statistics in other country:
Timeline:
This timeline shows a graph from 1995 to 2016 of Moldova. No data until 1994. Number of actual observations by date: 22.
Source name:
World Development Indicators
Source organization:
World Bank, International Debt Statistics.
Categories, topics:
Economy & Growth, External Debt
Last updated:
apr 23, 2017
Indicators value changes by year
Maximum:
10.737
jan 1, 2001
At the date of observation
Value
Absolute change
Change from previous value
jan 1, 1996
3.263
+1.963
150.93%
jan 1, 1997
3.481
+0.218
6.69%
jan 1, 1998
4.305
+0.824
23.66%
jan 1, 1999
5.913
+1.608
37.36%
jan 1, 2000
8.781
+2.868
48.51%
jan 1, 2001
10.737
+1.956
22.27%
jan 1, 2002
8.847
-1.89
-17.61%
jan 1, 2003
6.293
-2.554
-28.87%
jan 1, 2004
4.076
-2.217
-35.23%
jan 1, 2005
4.655
+0.579
14.2%
jan 1, 2006
3.796
-0.859
-18.46%
jan 1, 2007
4.298
+0.503
13.24%
jan 1, 2008
4.311
+0.013
0.29%
jan 1, 2009
2.957
-1.354
-31.41%
jan 1, 2010
3.102
+0.145
4.89%
jan 1, 2011
2.951
-0.15
-4.84%
jan 1, 2012
2.515
-0.436
-14.77%
jan 1, 2013
2.411
-0.104
-4.13%
jan 1, 2014
2.609
+0.197
8.18%
jan 1, 2015
2.669
+0.061
2.33%
jan 1, 2016
2.235
-0.434
-16.27%
Ranking of countries by current statistics by years


Comments: