29
/
en
AIzaSyAYiBZKx7MnpbEhh9jyipgxe19OcubqV5w
April 1, 2024
89974
Botswana
BWA
true
2
1
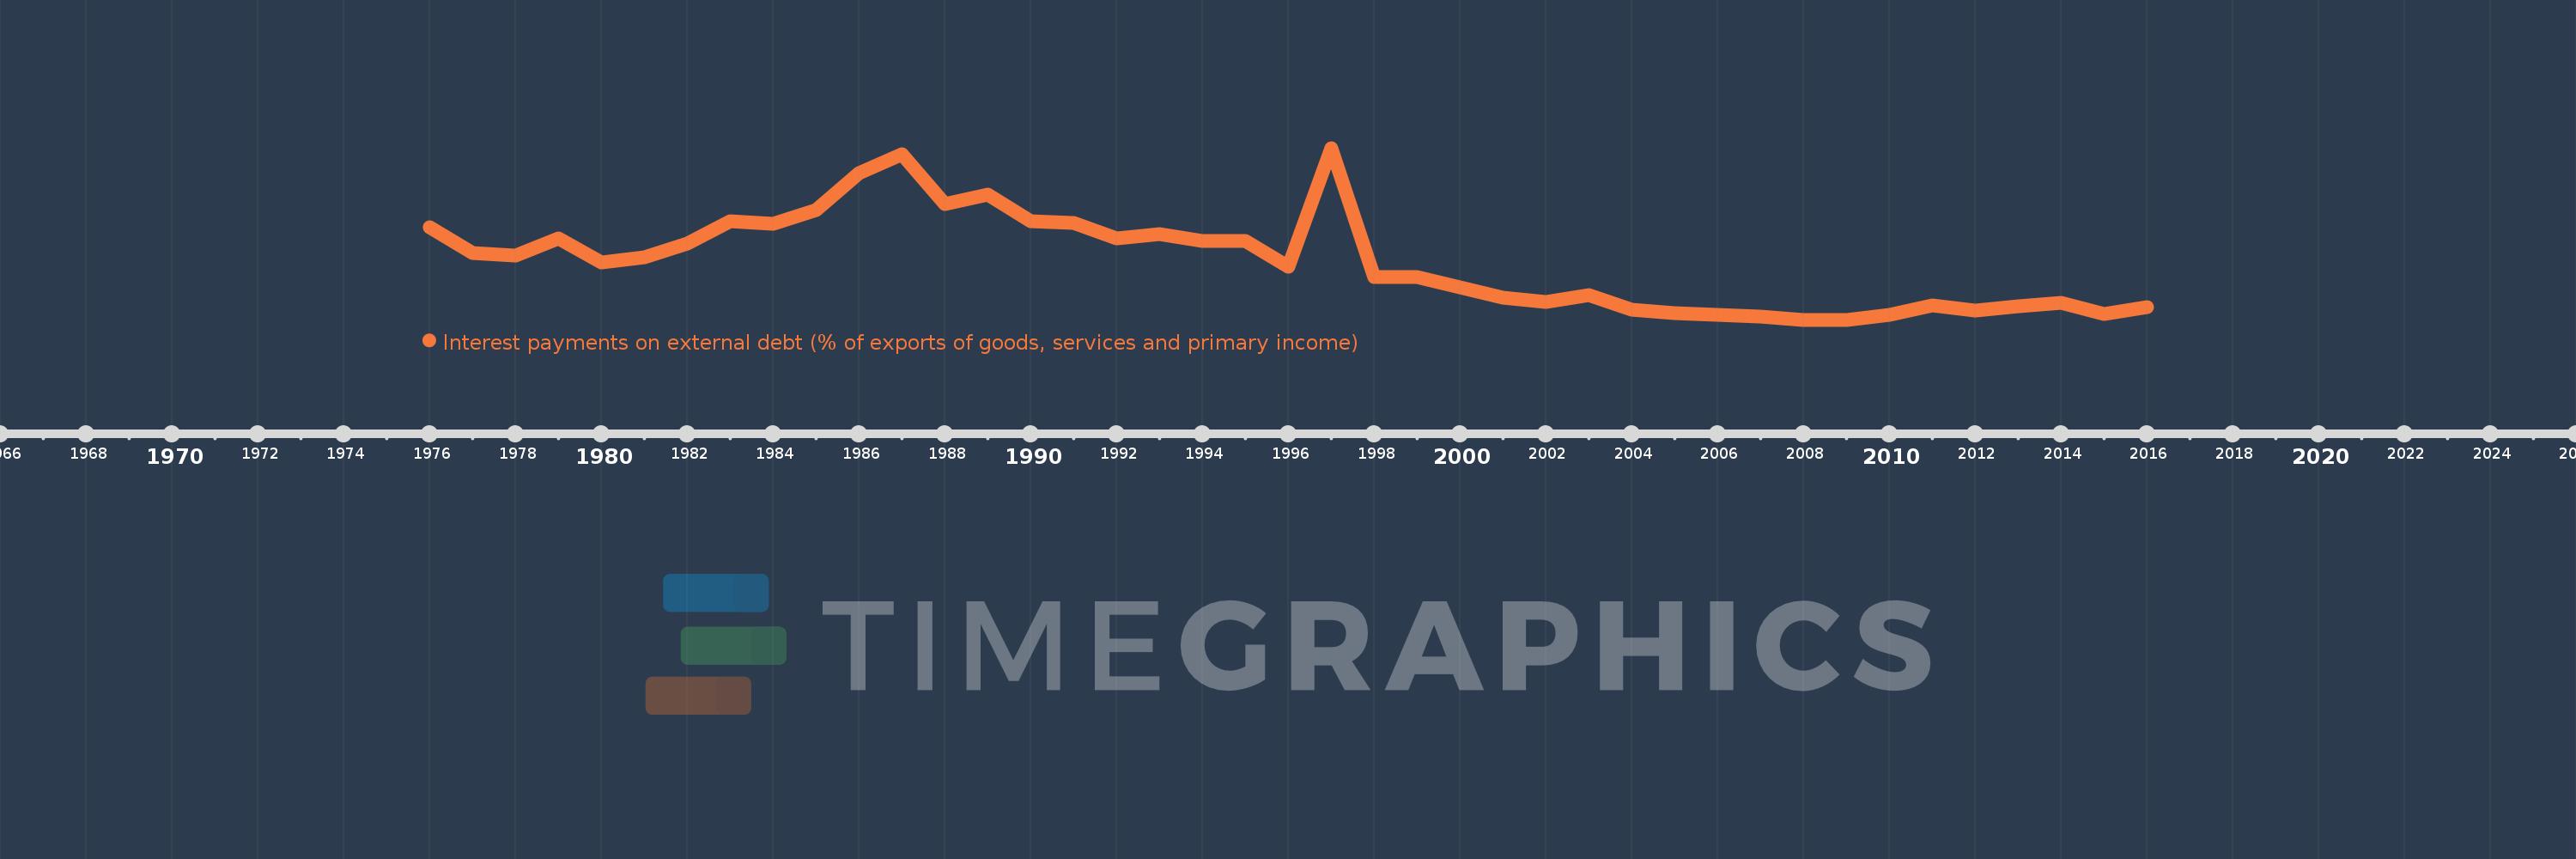
Interest payments on external debt (% of exports of goods, services and primary income)
2016,2015,2014,2013,2012,2011,2010,2009,2008,2007,2006,2005,2004,2003,2002,2001,2000,1999,1998,1997,1996,1995,1994,1993,1992,1991,1990,1989,1988,1987,1986,1985,1984,1983,1982,1981,1980,1979,1978,1977,1976
This statistics in other country:
Timeline:
This timeline shows a graph from 1976 to 2016 of Botswana. No data until 1975. Number of actual observations by date: 41.
Source name:
World Development Indicators
Source organization:
World Bank, International Debt Statistics.
Categories, topics:
Economy & Growth, External Debt
Last updated:
apr 23, 2017
Indicators value changes by year
At the date of observation
Value
Absolute change
Change from previous value
jan 1, 1976
1.531
+1.531
0.0%
jan 1, 1977
1.153
-0.378
-24.7%
jan 1, 1978
1.113
-0.04
-3.49%
jan 1, 1979
1.372
+0.259
23.3%
jan 1, 1980
1.004
-0.368
-26.82%
jan 1, 1981
1.093
+0.089
8.84%
jan 1, 1982
1.286
+0.193
17.65%
jan 1, 1983
1.628
+0.342
26.62%
jan 1, 1984
1.582
-0.046
-2.82%
jan 1, 1985
1.797
+0.215
13.59%
jan 1, 1986
2.347
+0.55
30.63%
jan 1, 1987
2.626
+0.278
11.86%
jan 1, 1988
1.88
-0.746
-28.41%
jan 1, 1989
2.017
+0.138
7.33%
jan 1, 1990
1.622
-0.395
-19.59%
jan 1, 1991
1.604
-0.018
-1.13%
jan 1, 1992
1.363
-0.241
-15.04%
jan 1, 1993
1.428
+0.066
4.83%
jan 1, 1994
1.334
-0.095
-6.62%
jan 1, 1995
1.329
-0.004
-0.33%
jan 1, 1996
0.946
-0.384
-28.87%
jan 1, 1997
2.718
+1.773
187.46%
jan 1, 1998
0.796
-1.922
-70.71%
jan 1, 1999
0.79
-0.006
-0.77%
jan 1, 2000
0.635
-0.155
-19.63%
jan 1, 2001
0.49
-0.145
-22.77%
jan 1, 2002
0.418
-0.072
-14.7%
jan 1, 2003
0.517
+0.099
23.71%
jan 1, 2004
0.305
-0.213
-41.15%
jan 1, 2005
0.251
-0.053
-17.55%
jan 1, 2006
0.228
-0.023
-9.2%
jan 1, 2007
0.203
-0.025
-10.8%
jan 1, 2008
0.155
-0.049
-23.91%
jan 1, 2009
0.155
+0.001
0.36%
jan 1, 2010
0.233
+0.078
50.29%
jan 1, 2011
0.365
+0.131
56.29%
jan 1, 2012
0.298
-0.067
-18.28%
jan 1, 2013
0.359
+0.061
20.56%
jan 1, 2014
0.41
+0.051
14.16%
jan 1, 2015
0.242
-0.168
-40.98%
jan 1, 2016
0.34
+0.098
40.58%
Ranking of countries by current statistics by years


Comments: