29
/
en
AIzaSyAYiBZKx7MnpbEhh9jyipgxe19OcubqV5w
April 1, 2024
194395
Mauritius
MUS
true
2
1
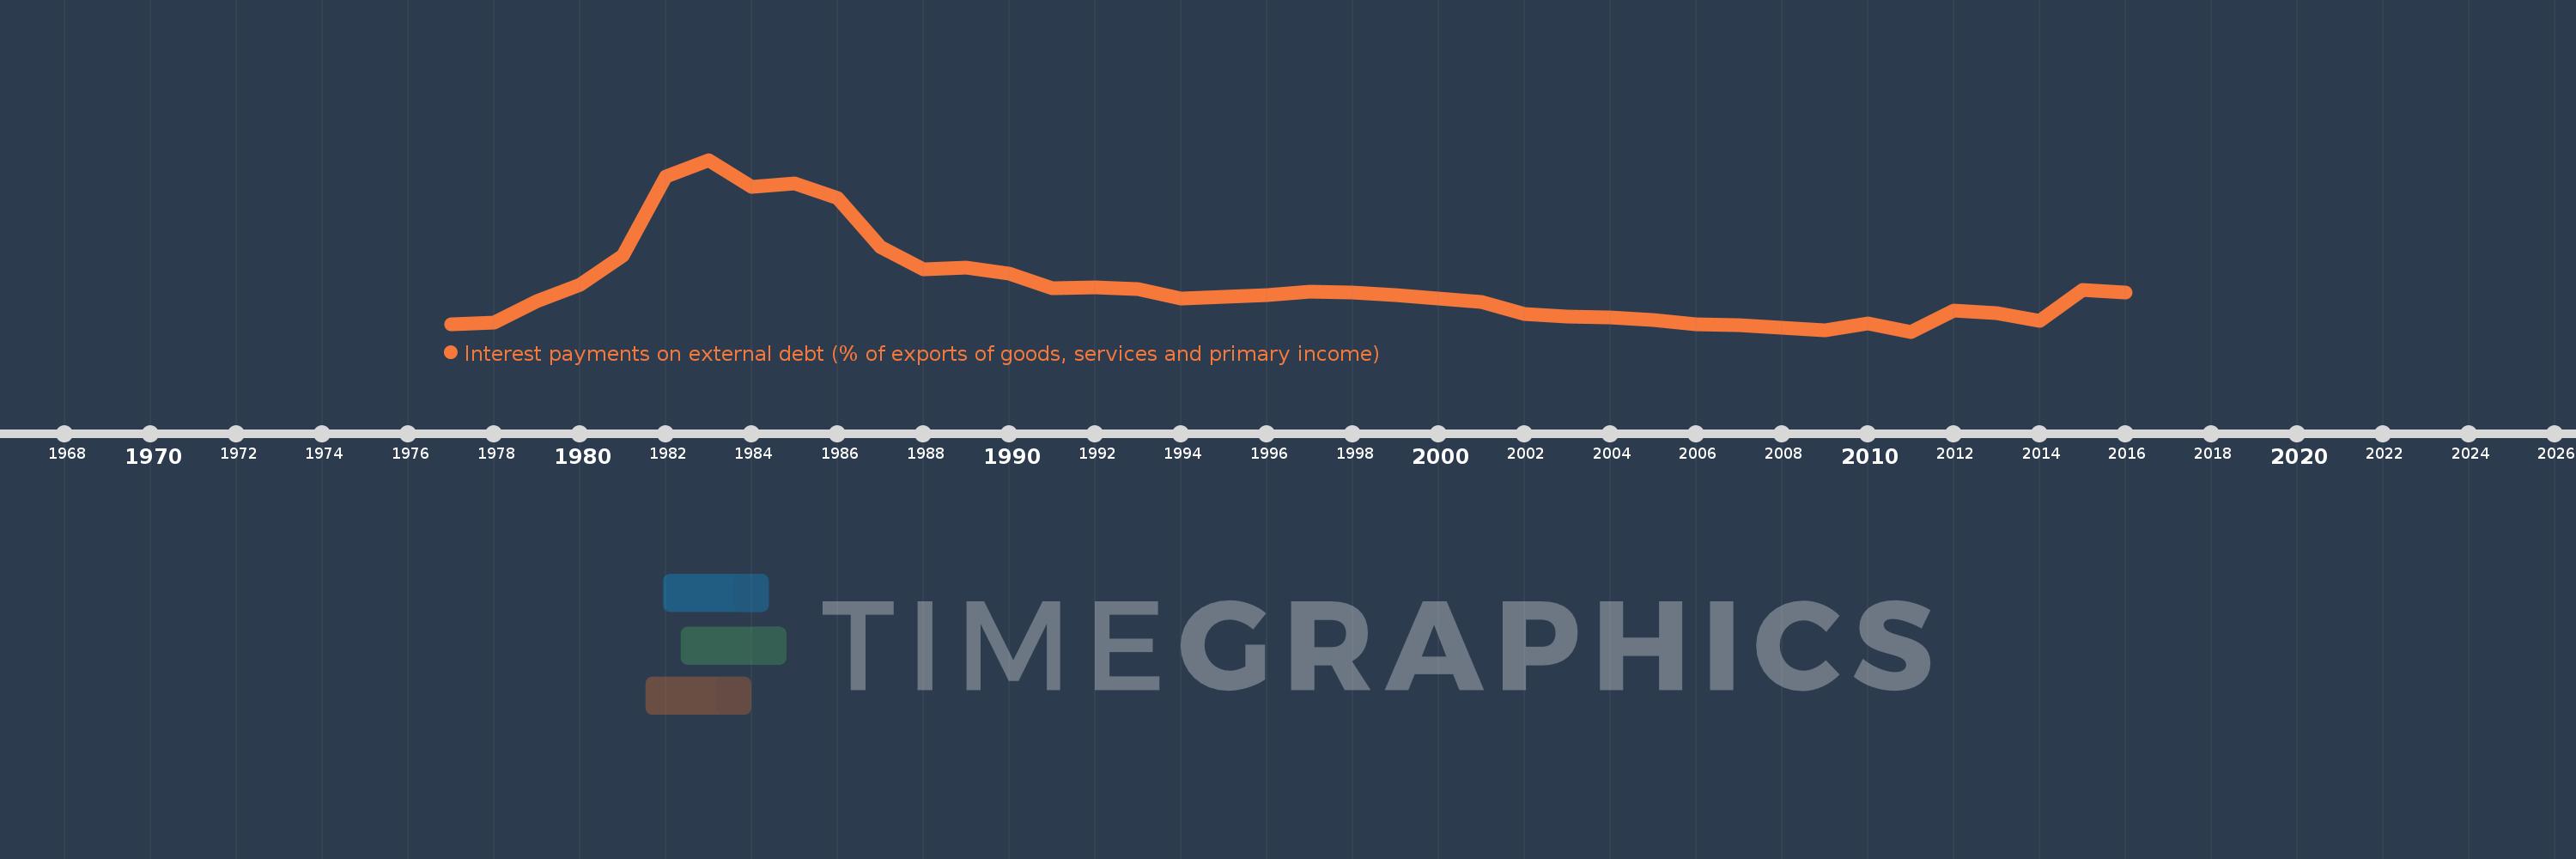
Interest payments on external debt (% of exports of goods, services and primary income)
2016,2015,2014,2013,2012,2011,2010,2009,2008,2007,2006,2005,2004,2003,2002,2001,2000,1999,1998,1997,1996,1995,1994,1993,1992,1991,1990,1989,1988,1987,1986,1985,1984,1983,1982,1981,1980,1979,1978,1977
This statistics in other country:
Timeline:
This timeline shows a graph from 1977 to 2016 of Mauritius. No data until 1976. Number of actual observations by date: 40.
Source name:
World Development Indicators
Source organization:
World Bank, International Debt Statistics.
Categories, topics:
Economy & Growth, External Debt
Last updated:
apr 23, 2017
Indicators value changes by year
At the date of observation
Value
Absolute change
Change from previous value
jan 1, 1977
0.741
+0.741
0.0%
jan 1, 1978
0.851
+0.11
14.79%
jan 1, 1979
2.029
+1.178
138.54%
jan 1, 1980
2.881
+0.852
42.0%
jan 1, 1981
4.439
+1.558
54.08%
jan 1, 1982
8.692
+4.253
95.79%
jan 1, 1983
9.614
+0.922
10.6%
jan 1, 1984
8.172
-1.442
-14.99%
jan 1, 1985
8.34
+0.168
2.05%
jan 1, 1986
7.546
-0.794
-9.52%
jan 1, 1987
4.936
-2.61
-34.59%
jan 1, 1988
3.724
-1.212
-24.55%
jan 1, 1989
3.793
+0.068
1.84%
jan 1, 1990
3.468
-0.324
-8.55%
jan 1, 1991
2.687
-0.781
-22.53%
jan 1, 1992
2.751
+0.064
2.37%
jan 1, 1993
2.641
-0.11
-3.99%
jan 1, 1994
2.152
-0.489
-18.53%
jan 1, 1995
2.222
+0.07
3.27%
jan 1, 1996
2.329
+0.107
4.83%
jan 1, 1997
2.529
+0.2
8.58%
jan 1, 1998
2.489
-0.04
-1.59%
jan 1, 1999
2.353
-0.136
-5.46%
jan 1, 2000
2.143
-0.21
-8.94%
jan 1, 2001
1.971
-0.171
-8.0%
jan 1, 2002
1.294
-0.678
-34.39%
jan 1, 2003
1.16
-0.133
-10.32%
jan 1, 2004
1.14
-0.02
-1.76%
jan 1, 2005
0.987
-0.153
-13.42%
jan 1, 2006
0.779
-0.208
-21.08%
jan 1, 2007
0.709
-0.069
-8.89%
jan 1, 2008
0.555
-0.154
-21.77%
jan 1, 2009
0.449
-0.106
-19.1%
jan 1, 2010
0.811
+0.361
80.51%
jan 1, 2011
0.367
-0.443
-54.72%
jan 1, 2012
1.486
+1.119
304.97%
jan 1, 2013
1.382
-0.104
-7.02%
jan 1, 2014
0.939
-0.443
-32.04%
jan 1, 2015
2.611
+1.672
178.06%
jan 1, 2016
2.491
-0.121
-4.62%
Ranking of countries by current statistics by years


Comments: