29
/
en
AIzaSyAYiBZKx7MnpbEhh9jyipgxe19OcubqV5w
April 1, 2024
187956
Malaysia
MYS
true
2
1
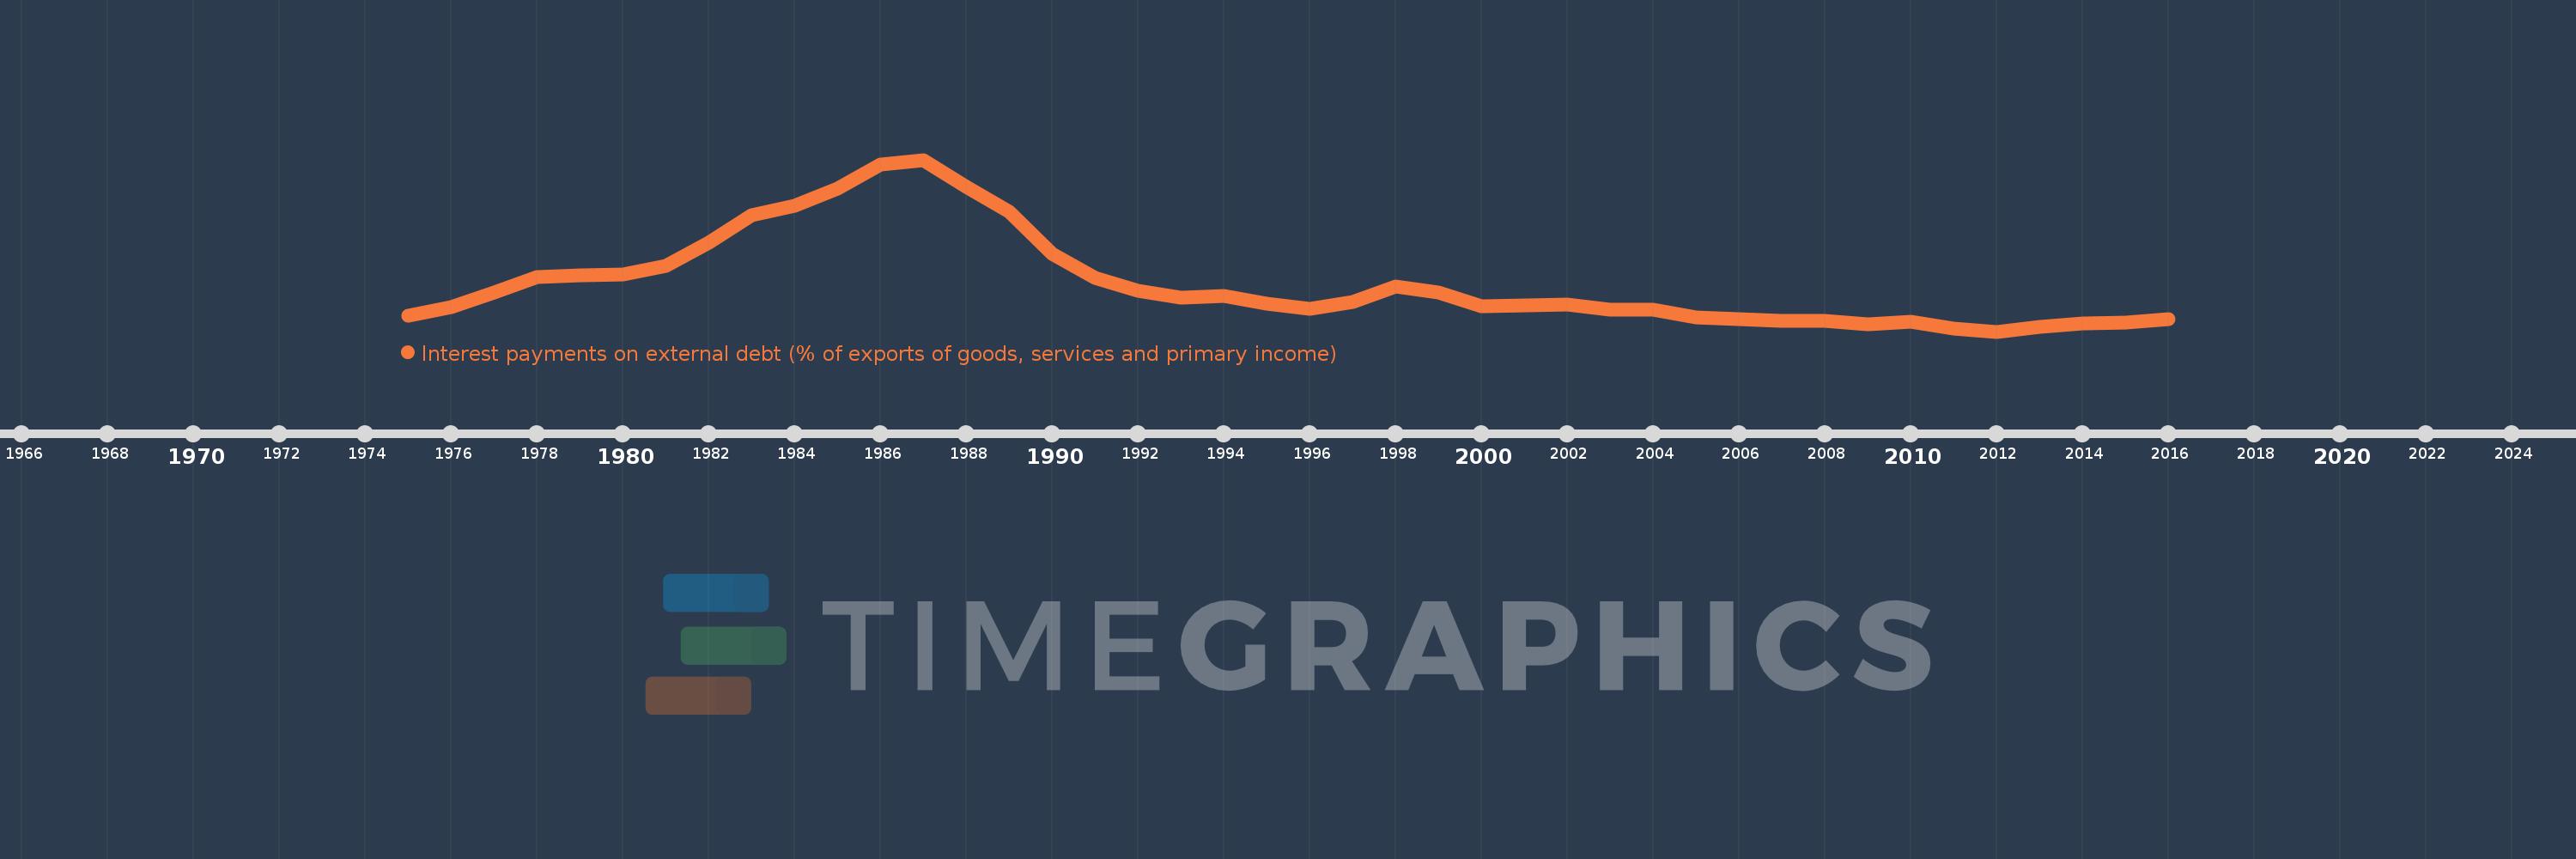
Interest payments on external debt (% of exports of goods, services and primary income)
2016,2015,2014,2013,2012,2011,2010,2009,2008,2007,2006,2005,2004,2003,2002,2001,2000,1999,1998,1997,1996,1995,1994,1993,1992,1991,1990,1989,1988,1987,1986,1985,1984,1983,1982,1981,1980,1979,1978,1977,1976,1975
This statistics in other country:
Timeline:
This timeline shows a graph from 1975 to 2016 of Malaysia. No data until 1974. Number of actual observations by date: 42.
Source name:
World Development Indicators
Source organization:
World Bank, International Debt Statistics.
Categories, topics:
Economy & Growth, External Debt
Last updated:
apr 23, 2017
Indicators value changes by year
At the date of observation
Value
Absolute change
Change from previous value
jan 1, 1975
1.497
+1.497
0.0%
jan 1, 1976
1.934
+0.437
29.21%
jan 1, 1977
2.658
+0.724
37.46%
jan 1, 1978
3.416
+0.758
28.5%
jan 1, 1979
3.509
+0.093
2.72%
jan 1, 1980
3.565
+0.056
1.59%
jan 1, 1981
3.971
+0.407
11.41%
jan 1, 1982
5.121
+1.149
28.94%
jan 1, 1983
6.507
+1.386
27.07%
jan 1, 1984
6.997
+0.49
7.53%
jan 1, 1985
7.852
+0.856
12.23%
jan 1, 1986
9.034
+1.181
15.04%
jan 1, 1987
9.272
+0.238
2.63%
jan 1, 1988
7.919
-1.352
-14.58%
jan 1, 1989
6.687
-1.233
-15.57%
jan 1, 1990
4.588
-2.098
-31.38%
jan 1, 1991
3.379
-1.21
-26.36%
jan 1, 1992
2.733
-0.646
-19.12%
jan 1, 1993
2.386
-0.347
-12.7%
jan 1, 1994
2.478
+0.093
3.88%
jan 1, 1995
2.089
-0.389
-15.71%
jan 1, 1996
1.851
-0.239
-11.42%
jan 1, 1997
2.198
+0.347
18.77%
jan 1, 1998
2.959
+0.761
34.6%
jan 1, 1999
2.67
-0.288
-9.74%
jan 1, 2000
1.968
-0.702
-26.3%
jan 1, 2001
2.008
+0.04
2.05%
jan 1, 2002
2.047
+0.039
1.92%
jan 1, 2003
1.773
-0.274
-13.38%
jan 1, 2004
1.782
+0.009
0.5%
jan 1, 2005
1.403
-0.379
-21.28%
jan 1, 2006
1.313
-0.09
-6.41%
jan 1, 2007
1.233
-0.08
-6.09%
jan 1, 2008
1.215
-0.018
-1.48%
jan 1, 2009
1.07
-0.145
-11.93%
jan 1, 2010
1.181
+0.111
10.36%
jan 1, 2011
0.859
-0.321
-27.21%
jan 1, 2012
0.698
-0.162
-18.82%
jan 1, 2013
0.914
+0.216
31.01%
jan 1, 2014
1.108
+0.194
21.2%
jan 1, 2015
1.156
+0.048
4.33%
jan 1, 2016
1.333
+0.177
15.3%
Ranking of countries by current statistics by years


Comments: