29
/
en
AIzaSyAYiBZKx7MnpbEhh9jyipgxe19OcubqV5w
April 1, 2024
204240
Myanmar
MMR
true
2
1
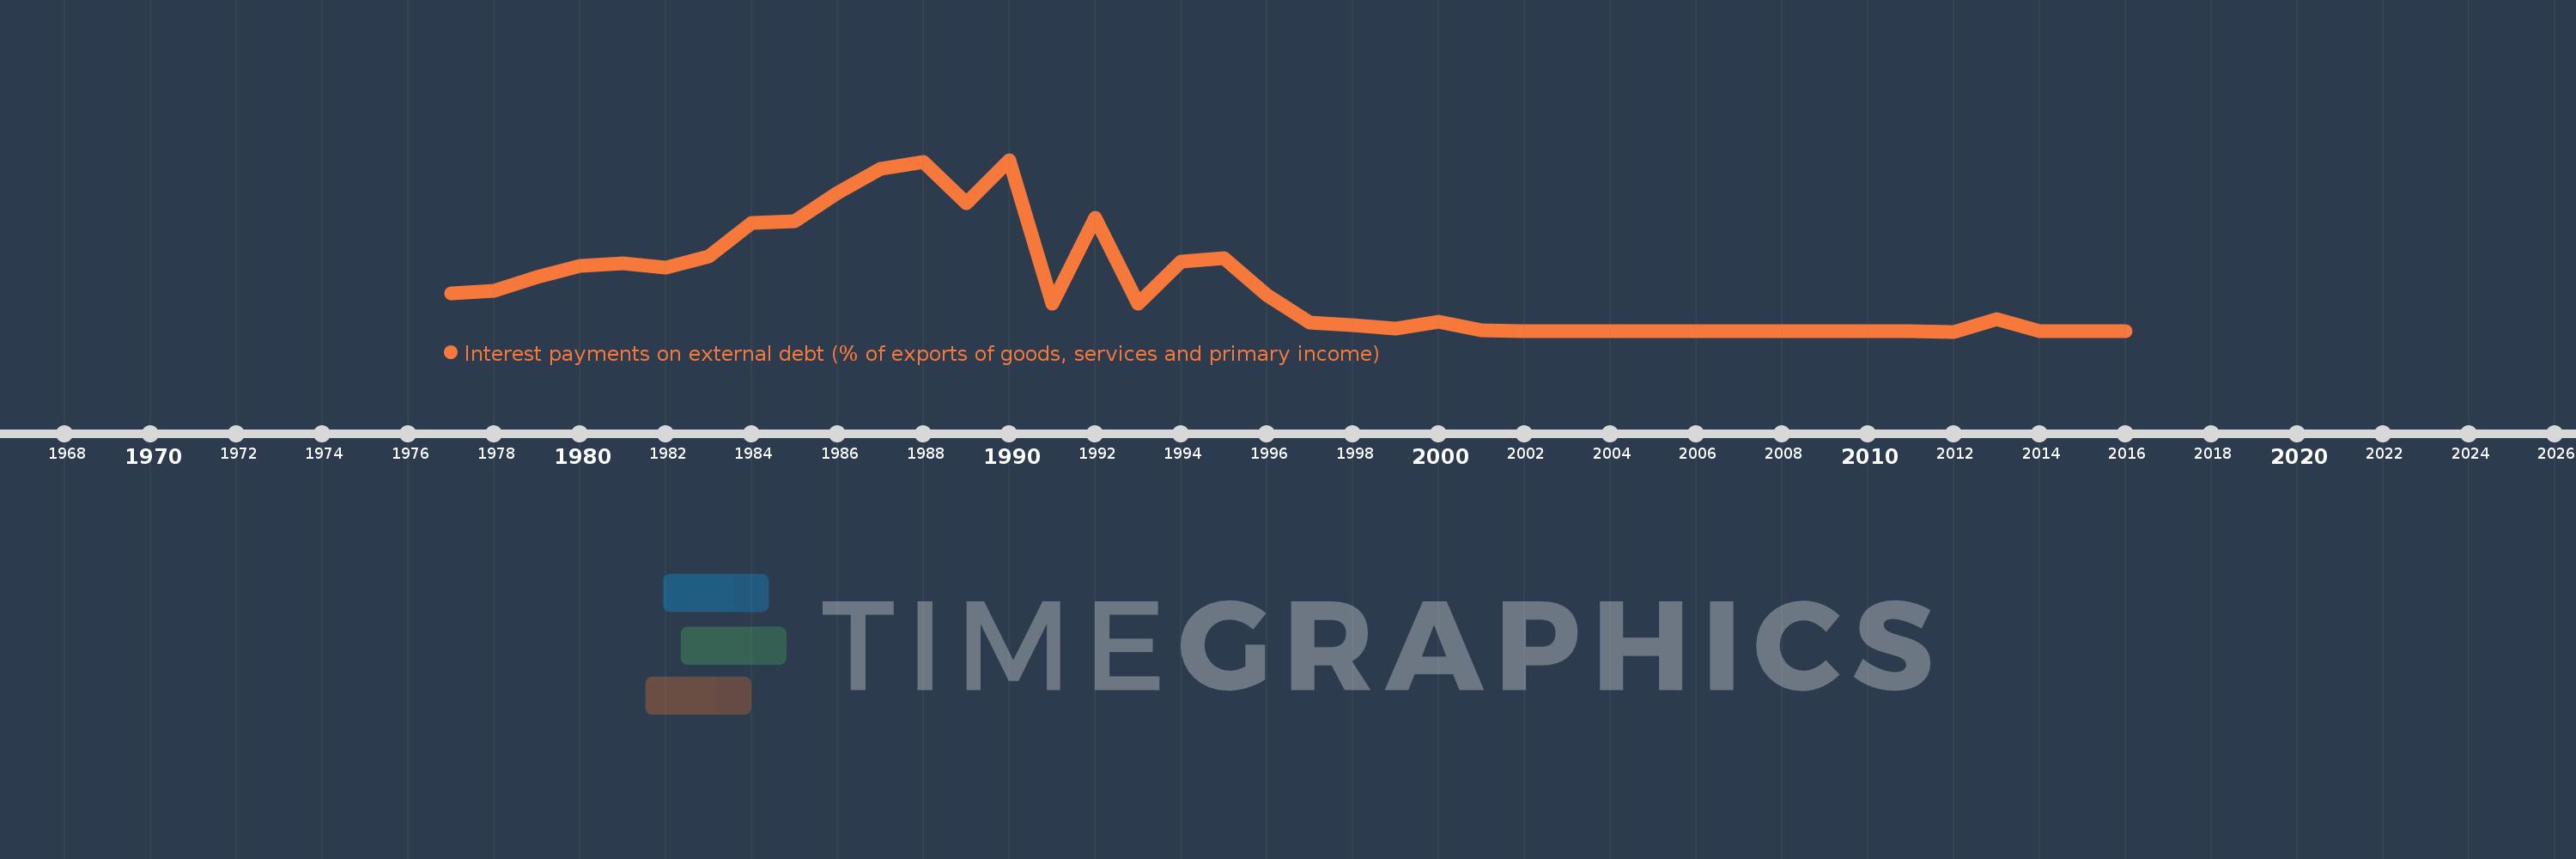
Interest payments on external debt (% of exports of goods, services and primary income)
2016,2015,2014,2013,2012,2011,2010,2009,2008,2007,2006,2005,2004,2003,2002,2001,2000,1999,1998,1997,1996,1995,1994,1993,1992,1991,1990,1989,1988,1987,1986,1985,1984,1983,1982,1981,1980,1979,1978,1977
This statistics in other country:
Timeline:
This timeline shows a graph from 1977 to 2016 of Myanmar. No data until 1976. Number of actual observations by date: 40.
Source name:
World Development Indicators
Source organization:
World Bank, International Debt Statistics.
Categories, topics:
Economy & Growth, External Debt
Last updated:
apr 23, 2017
Indicators value changes by year
Maximum:
24.632
jan 1, 1990
At the date of observation
Value
Absolute change
Change from previous value
jan 1, 1977
5.536
+5.536
0.0%
jan 1, 1978
5.888
+0.352
6.37%
jan 1, 1979
7.865
+1.977
33.58%
jan 1, 1980
9.423
+1.558
19.81%
jan 1, 1981
9.811
+0.388
4.12%
jan 1, 1982
9.222
-0.589
-6.0%
jan 1, 1983
10.805
+1.583
17.16%
jan 1, 1984
15.574
+4.769
44.13%
jan 1, 1985
15.86
+0.286
1.83%
jan 1, 1986
19.922
+4.062
25.61%
jan 1, 1987
23.302
+3.38
16.97%
jan 1, 1988
24.322
+1.02
4.38%
jan 1, 1989
18.365
-5.957
-24.49%
jan 1, 1990
24.632
+6.267
34.12%
jan 1, 1991
3.977
-20.655
-83.85%
jan 1, 1992
16.333
+12.355
310.64%
jan 1, 1993
3.974
-12.359
-75.67%
jan 1, 1994
10.085
+6.111
153.77%
jan 1, 1995
10.563
+0.479
4.75%
jan 1, 1996
5.198
-5.365
-50.79%
jan 1, 1997
1.302
-3.897
-74.96%
jan 1, 1998
0.891
-0.41
-31.52%
jan 1, 1999
0.505
-0.386
-43.35%
jan 1, 2000
1.413
+0.908
179.86%
jan 1, 2001
0.148
-1.265
-89.52%
jan 1, 2002
0.059
-0.089
-60.12%
jan 1, 2003
0.058
-0.001
-1.68%
jan 1, 2004
0.047
-0.011
-19.22%
jan 1, 2005
0.057
+0.01
20.81%
jan 1, 2006
0.054
-0.003
-4.81%
jan 1, 2007
0.062
+0.008
14.87%
jan 1, 2008
0.061
-0.001
-2.1%
jan 1, 2009
0.027
-0.034
-55.39%
jan 1, 2010
0.032
+0.005
19.84%
jan 1, 2011
0.026
-0.007
-20.81%
jan 1, 2012
0.014
-0.012
-46.27%
jan 1, 2013
1.84
+1.827
13.23K%
jan 1, 2014
0.105
-1.736
-94.3%
jan 1, 2015
0.098
-0.007
-6.93%
jan 1, 2016
0.083
-0.014
-14.58%
Ranking of countries by current statistics by years


Comments: