29
/
en
AIzaSyAYiBZKx7MnpbEhh9jyipgxe19OcubqV5w
April 1, 2024
235943
Senegal
SEN
true
2
1
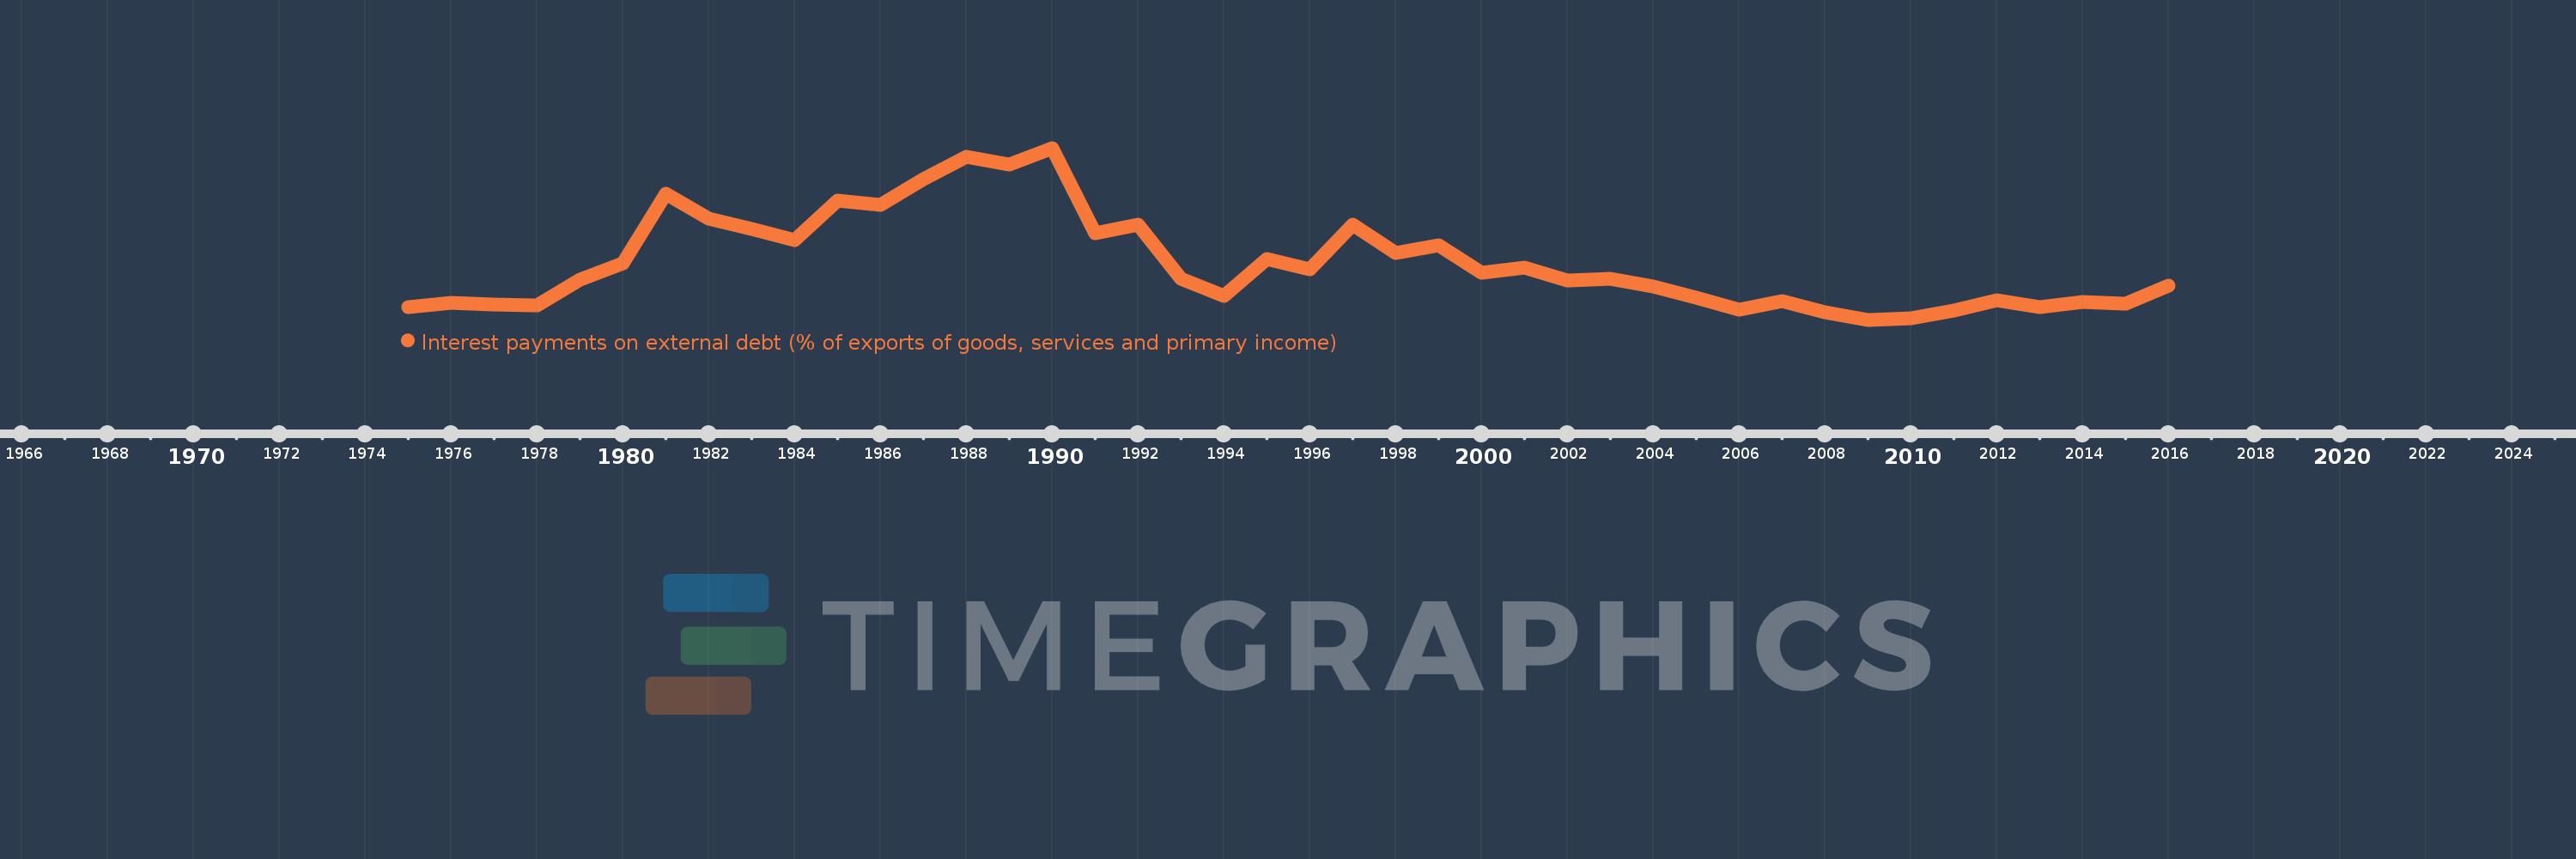
Interest payments on external debt (% of exports of goods, services and primary income)
2016,2015,2014,2013,2012,2011,2010,2009,2008,2007,2006,2005,2004,2003,2002,2001,2000,1999,1998,1997,1996,1995,1994,1993,1992,1991,1990,1989,1988,1987,1986,1985,1984,1983,1982,1981,1980,1979,1978,1977,1976,1975
This statistics in other country:
Timeline:
This timeline shows a graph from 1975 to 2016 of Senegal. No data until 1974. Number of actual observations by date: 42.
Source name:
World Development Indicators
Source organization:
World Bank, International Debt Statistics.
Categories, topics:
Economy & Growth, External Debt
Last updated:
apr 23, 2017
Indicators value changes by year
Maximum:
15.026
jan 1, 1990
At the date of observation
Value
Absolute change
Change from previous value
jan 1, 1975
2.425
+2.425
0.0%
jan 1, 1976
2.779
+0.354
14.59%
jan 1, 1977
2.656
-0.123
-4.41%
jan 1, 1978
2.579
-0.077
-2.9%
jan 1, 1979
4.63
+2.051
79.53%
jan 1, 1980
5.887
+1.257
27.14%
jan 1, 1981
11.414
+5.528
93.9%
jan 1, 1982
9.461
-1.953
-17.11%
jan 1, 1983
8.654
-0.807
-8.53%
jan 1, 1984
7.724
-0.93
-10.74%
jan 1, 1985
10.87
+3.146
40.72%
jan 1, 1986
10.526
-0.344
-3.17%
jan 1, 1987
12.531
+2.005
19.05%
jan 1, 1988
14.358
+1.827
14.58%
jan 1, 1989
13.745
-0.613
-4.27%
jan 1, 1990
15.026
+1.28
9.32%
jan 1, 1991
8.318
-6.708
-44.64%
jan 1, 1992
8.968
+0.65
7.81%
jan 1, 1993
4.707
-4.261
-47.51%
jan 1, 1994
3.366
-1.341
-28.49%
jan 1, 1995
6.234
+2.868
85.2%
jan 1, 1996
5.439
-0.796
-12.76%
jan 1, 1997
9.001
+3.563
65.51%
jan 1, 1998
6.76
-2.241
-24.9%
jan 1, 1999
7.307
+0.547
8.1%
jan 1, 2000
5.139
-2.168
-29.67%
jan 1, 2001
5.592
+0.452
8.8%
jan 1, 2002
4.524
-1.067
-19.09%
jan 1, 2003
4.684
+0.159
3.52%
jan 1, 2004
4.052
-0.631
-13.48%
jan 1, 2005
3.196
-0.856
-21.13%
jan 1, 2006
2.278
-0.918
-28.72%
jan 1, 2007
2.925
+0.647
28.38%
jan 1, 2008
2.078
-0.847
-28.96%
jan 1, 2009
1.457
-0.621
-29.88%
jan 1, 2010
1.567
+0.11
7.53%
jan 1, 2011
2.208
+0.642
40.95%
jan 1, 2012
3.022
+0.813
36.84%
jan 1, 2013
2.426
-0.595
-19.71%
jan 1, 2014
2.85
+0.424
17.47%
jan 1, 2015
2.753
-0.097
-3.42%
jan 1, 2016
4.173
+1.42
51.6%
Ranking of countries by current statistics by years


Comments: