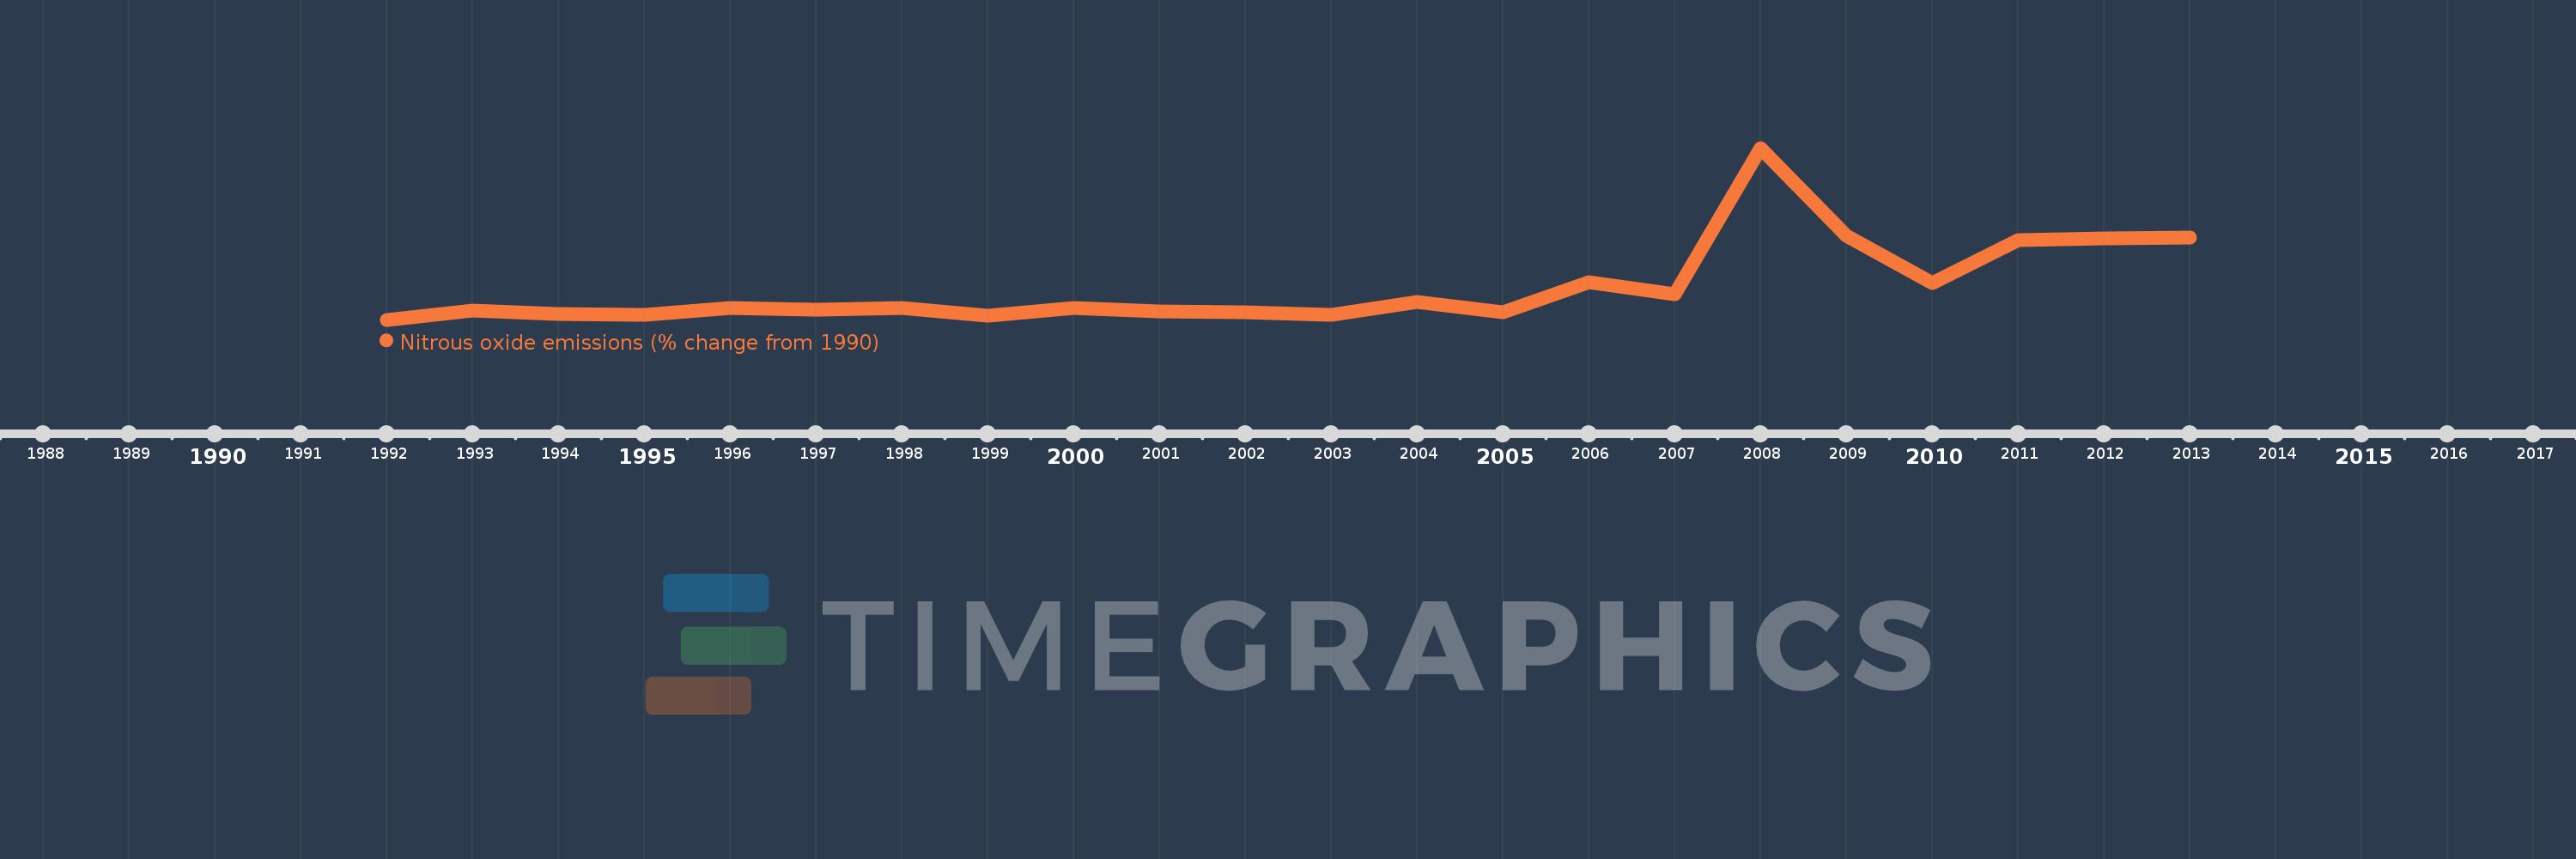
This timeline shows a graph from 1992 to 2013 of Uganda. No data until 1991. Number of actual observations by date: 22.
Source name:
World Development Indicators
Source organization:
World Bank staff estimates from original source: European Commission, Joint Research Centre (JRC)/Netherlands Environmental Assessment Agency (PBL). Emission Database for Global Atmospheric Research (EDGAR): http://edgar.jrc.ec.europa.eu/.
Categories, topics:
Climate Change, Environment
Last updated:
apr 23, 2017
Indicators value changes by year
Meaning:
24.752
Minimum:
-15.376
jan 1, 1992
Maximum:
197.046
jan 1, 2008
At the date of observation
Value
Absolute change
Change from the previous value
jan 1, 1992
-15.376
-15.376
0.0%
jan 1, 1993
-4.261
+11.115
-72.29%
jan 1, 1994
-7.788
-3.527
82.79%
jan 1, 1995
-9.652
-1.863
23.93%
jan 1, 1996
-0.982
+8.67
-89.82%
jan 1, 1997
-3.032
-2.05
208.76%
jan 1, 1998
-0.758
+2.274
-74.99%
jan 1, 1999
-10.295
-9.537
1.26K%
jan 1, 2000
-0.982
+9.314
-90.46%
jan 1, 2001
-5.405
-4.423
450.61%
jan 1, 2002
-6.57
-1.165
21.55%
jan 1, 2003
-8.996
-2.426
36.93%
jan 1, 2004
6.444
+15.44
-171.64%
jan 1, 2005
-5.999
-12.443
-193.1%
jan 1, 2006
31.04
+37.039
-617.4%
jan 1, 2007
16.321
-14.719
-47.42%
jan 1, 2008
197.046
+180.726
1.11K%
jan 1, 2009
88.784
-108.263
-54.94%
jan 1, 2010
30.493
-58.291
-65.65%
jan 1, 2011
83.011
+52.518
172.23%
jan 1, 2012
84.841
+1.83
2.2%
jan 1, 2013
86.671
+1.83
2.16%
Ranking of countries by current statistics by years
