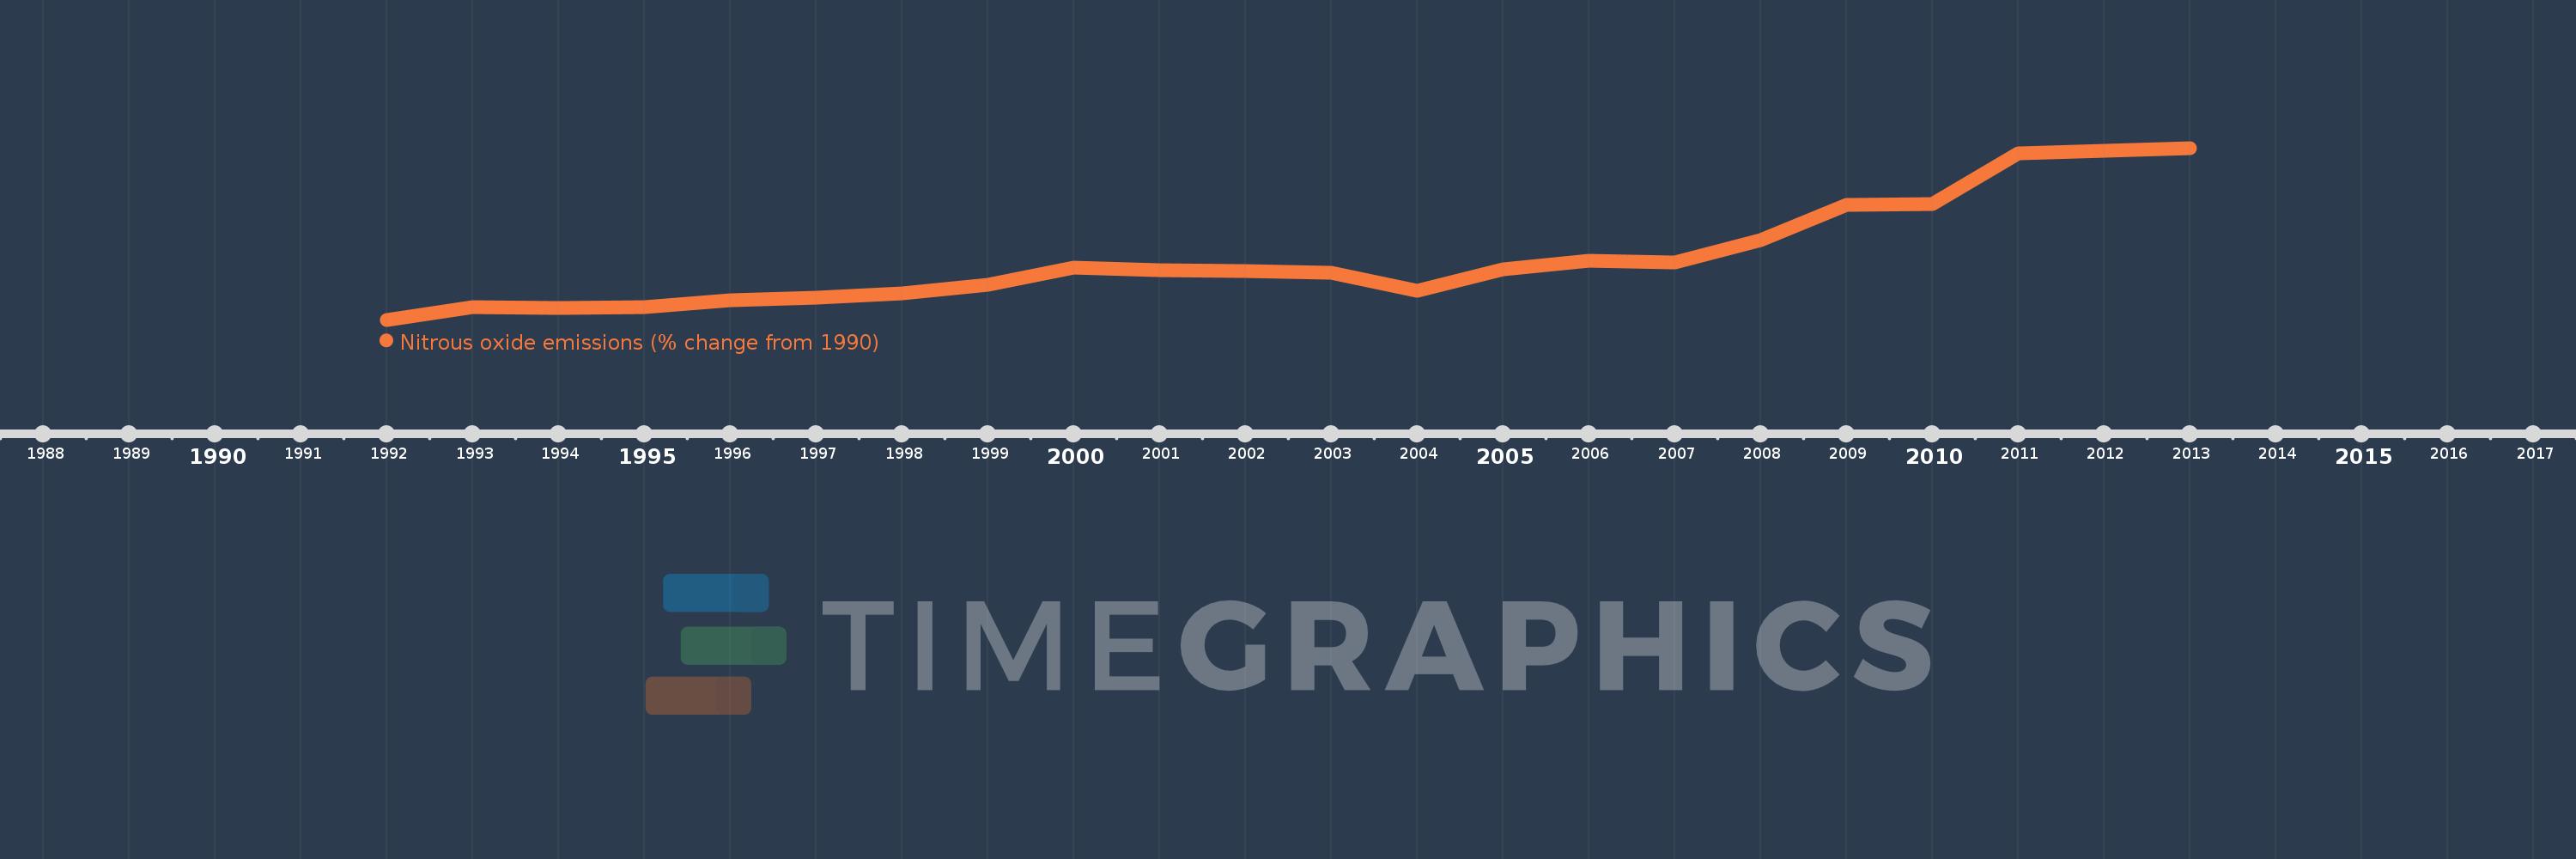
This timeline shows a graph from 1992 to 2013 of Senegal. No data until 1991. Number of actual observations by date: 22.
Source name:
World Development Indicators
Source organization:
World Bank staff estimates from original source: European Commission, Joint Research Centre (JRC)/Netherlands Environmental Assessment Agency (PBL). Emission Database for Global Atmospheric Research (EDGAR): http://edgar.jrc.ec.europa.eu/.
Categories, topics:
Climate Change, Environment
Last updated:
apr 23, 2017
Indicators value changes by year
Meaning:
37.798
Minimum:
-8.432
jan 1, 1992
Maximum:
121.081
jan 1, 2013
At the date of observation
Value
Absolute change
Change from the previous value
jan 1, 1992
-8.432
-8.432
0.0%
jan 1, 1993
0.785
+9.218
-109.31%
jan 1, 1994
0.403
-0.383
-48.72%
jan 1, 1995
1.297
+0.894
222.1%
jan 1, 1996
6.162
+4.865
375.02%
jan 1, 1997
8.341
+2.179
35.36%
jan 1, 1998
11.59
+3.249
38.96%
jan 1, 1999
17.611
+6.02
51.94%
jan 1, 2000
31.174
+13.564
77.02%
jan 1, 2001
28.875
-2.299
-7.37%
jan 1, 2002
28.353
-0.522
-1.81%
jan 1, 2003
27.141
-1.212
-4.27%
jan 1, 2004
13.392
-13.749
-50.66%
jan 1, 2005
29.466
+16.074
120.03%
jan 1, 2006
36.17
+6.703
22.75%
jan 1, 2007
34.501
-1.669
-4.61%
jan 1, 2008
51.35
+16.849
48.84%
jan 1, 2009
77.889
+26.539
51.68%
jan 1, 2010
78.745
+0.855
1.1%
jan 1, 2011
116.746
+38.001
48.26%
jan 1, 2012
118.913
+2.167
1.86%
jan 1, 2013
121.081
+2.167
1.82%
Ranking of countries by current statistics by years
