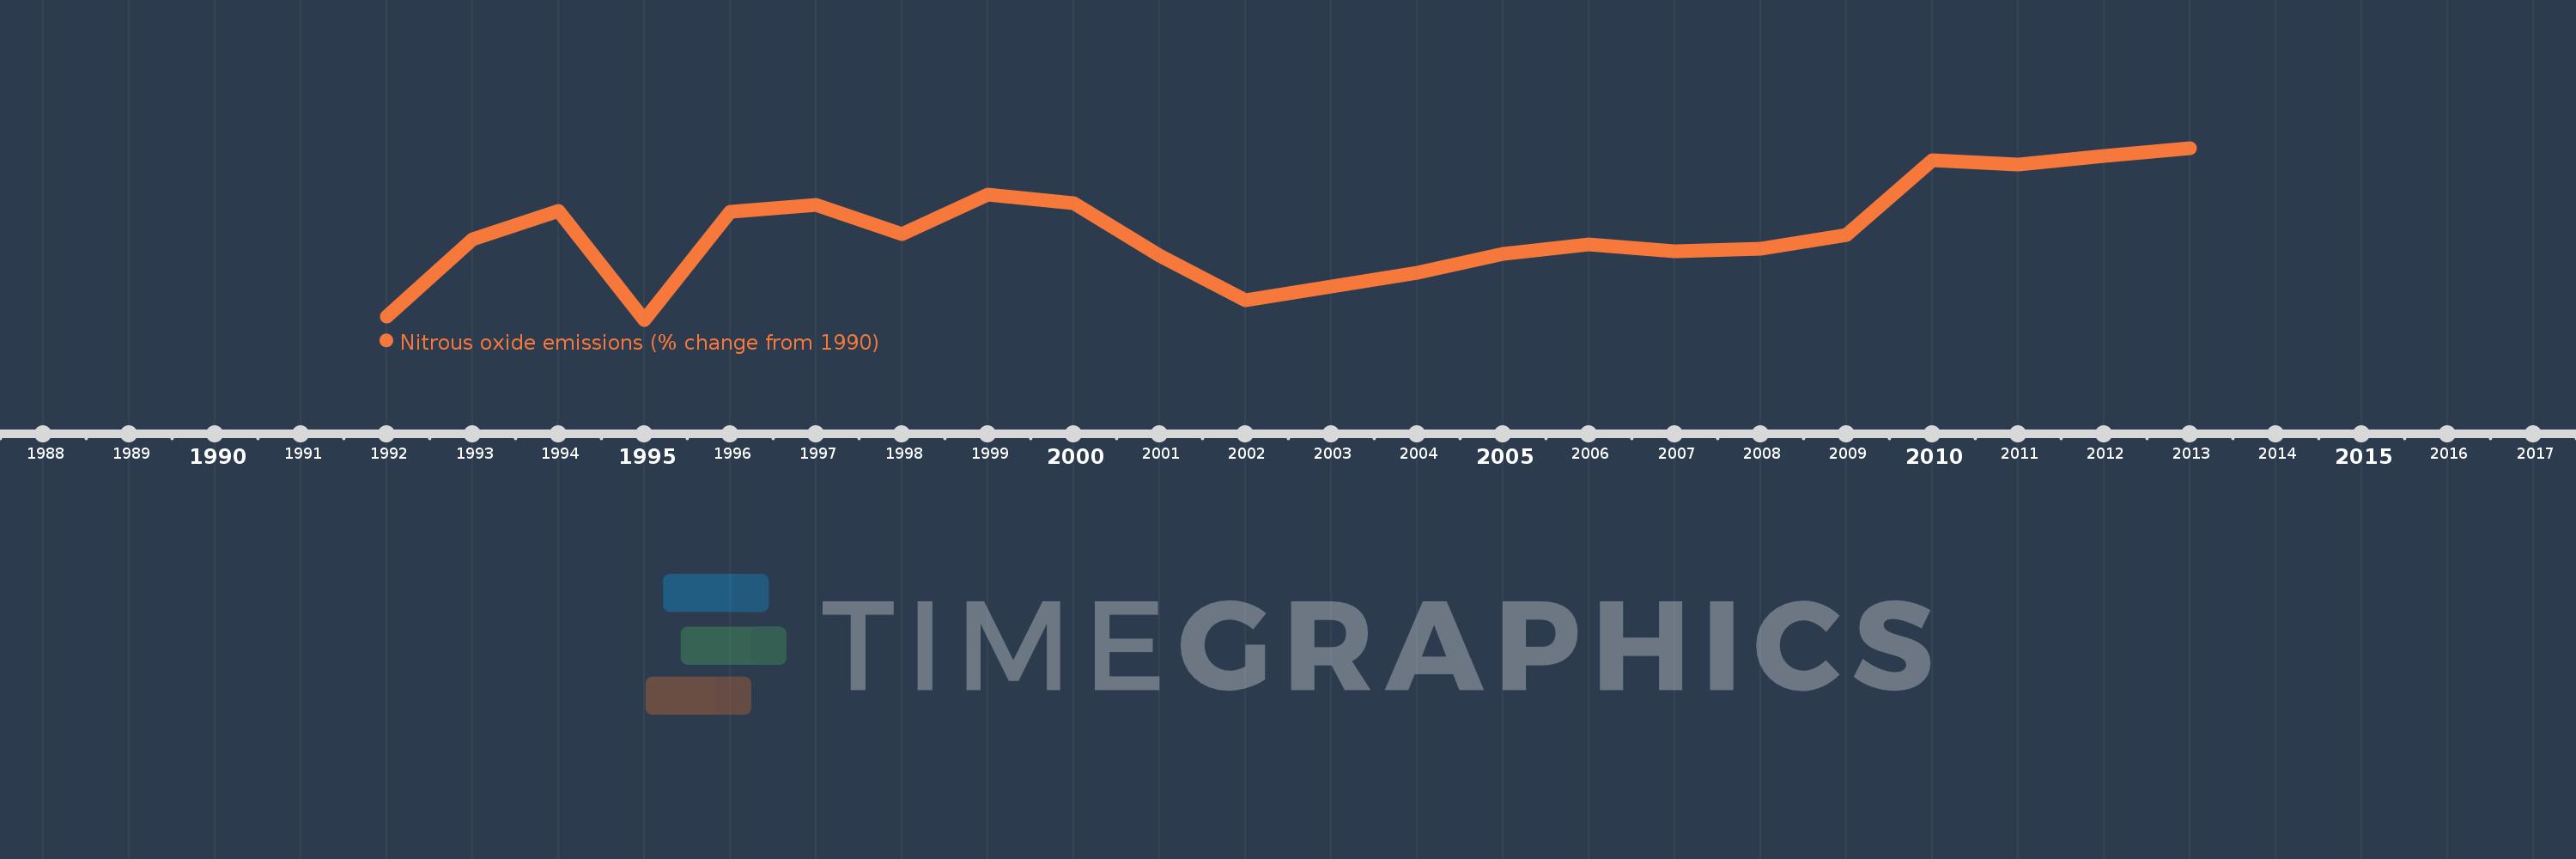
This timeline shows a graph from 1992 to 2013 of Turkey. No data until 1991. Number of actual observations by date: 22.
Source name:
World Development Indicators
Source organization:
World Bank staff estimates from original source: European Commission, Joint Research Centre (JRC)/Netherlands Environmental Assessment Agency (PBL). Emission Database for Global Atmospheric Research (EDGAR): http://edgar.jrc.ec.europa.eu/.
Categories, topics:
Climate Change, Environment
Last updated:
apr 23, 2017
Indicators value changes by year
Meaning:
12.057
Minimum:
-0.94
jan 1, 1995
Maximum:
24.606
jan 1, 2013
At the date of observation
Value
Absolute change
Change from the previous value
jan 1, 1992
-0.429
-0.429
0.0%
jan 1, 1993
11.059
+11.488
-2.68K%
jan 1, 1994
15.284
+4.225
38.2%
jan 1, 1995
-0.94
-16.224
-106.15%
jan 1, 1996
15.099
+16.039
-1.71K%
jan 1, 1997
16.075
+0.975
6.46%
jan 1, 1998
11.76
-4.315
-26.84%
jan 1, 1999
17.723
+5.964
50.71%
jan 1, 2000
16.455
-1.268
-7.15%
jan 1, 2001
8.611
-7.845
-47.67%
jan 1, 2002
1.898
-6.712
-77.95%
jan 1, 2003
4.049
+2.151
113.31%
jan 1, 2004
6.024
+1.975
48.76%
jan 1, 2005
8.873
+2.849
47.3%
jan 1, 2006
10.266
+1.393
15.7%
jan 1, 2007
9.239
-1.027
-10.01%
jan 1, 2008
9.614
+0.375
4.06%
jan 1, 2009
11.636
+2.022
21.03%
jan 1, 2010
22.815
+11.179
96.07%
jan 1, 2011
22.163
-0.652
-2.86%
jan 1, 2012
23.385
+1.222
5.51%
jan 1, 2013
24.606
+1.222
5.22%
Ranking of countries by current statistics by years
