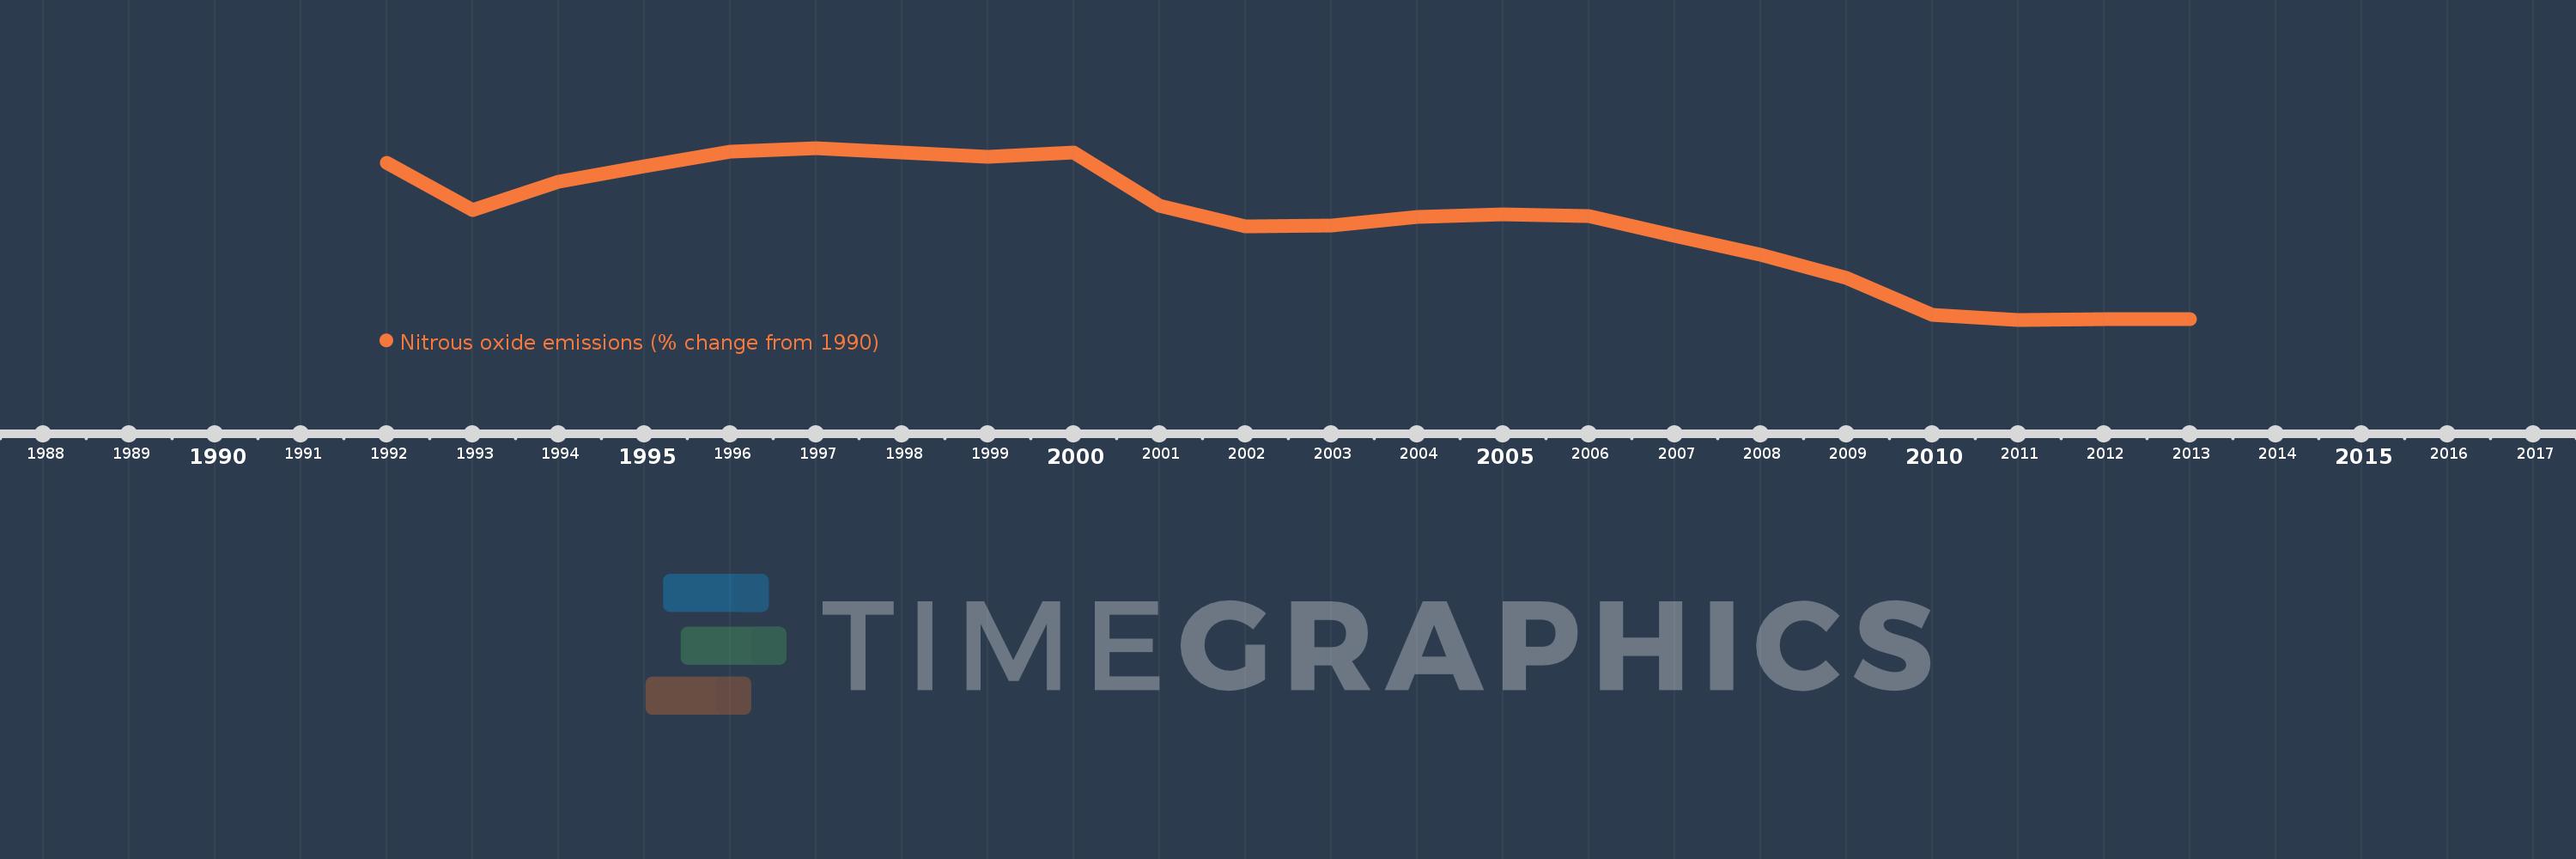
This timeline shows a graph from 1992 to 2013 of Norway. No data until 1991. Number of actual observations by date: 22.
Source name:
World Development Indicators
Source organization:
World Bank staff estimates from original source: European Commission, Joint Research Centre (JRC)/Netherlands Environmental Assessment Agency (PBL). Emission Database for Global Atmospheric Research (EDGAR): http://edgar.jrc.ec.europa.eu/.
Categories, topics:
Climate Change, Environment
Last updated:
apr 23, 2017
Indicators value changes by year
Meaning:
-13.674
Minimum:
-40.179
jan 1, 2011
Maximum:
5.253
jan 1, 1997
At the date of observation
Value
Absolute change
Change from the previous value
jan 1, 1992
1.237
+1.237
0.0%
jan 1, 1993
-11.112
-12.349
-998.14%
jan 1, 1994
-3.685
+7.427
-66.84%
jan 1, 1995
0.504
+4.189
-113.68%
jan 1, 1996
4.348
+3.844
762.43%
jan 1, 1997
5.253
+0.904
20.8%
jan 1, 1998
4.112
-1.141
-21.72%
jan 1, 1999
2.827
-1.284
-31.24%
jan 1, 2000
3.972
+1.145
40.5%
jan 1, 2001
-10.064
-14.037
-353.36%
jan 1, 2002
-15.449
-5.385
53.5%
jan 1, 2003
-15.339
+0.111
-0.72%
jan 1, 2004
-12.993
+2.345
-15.29%
jan 1, 2005
-12.398
+0.595
-4.58%
jan 1, 2006
-12.662
-0.264
2.13%
jan 1, 2007
-17.943
-5.281
41.71%
jan 1, 2008
-22.986
-5.043
28.11%
jan 1, 2009
-29.156
-6.17
26.84%
jan 1, 2010
-38.919
-9.763
33.48%
jan 1, 2011
-40.179
-1.26
3.24%
jan 1, 2012
-40.125
+0.054
-0.13%
jan 1, 2013
-40.071
+0.054
-0.13%
Ranking of countries by current statistics by years
