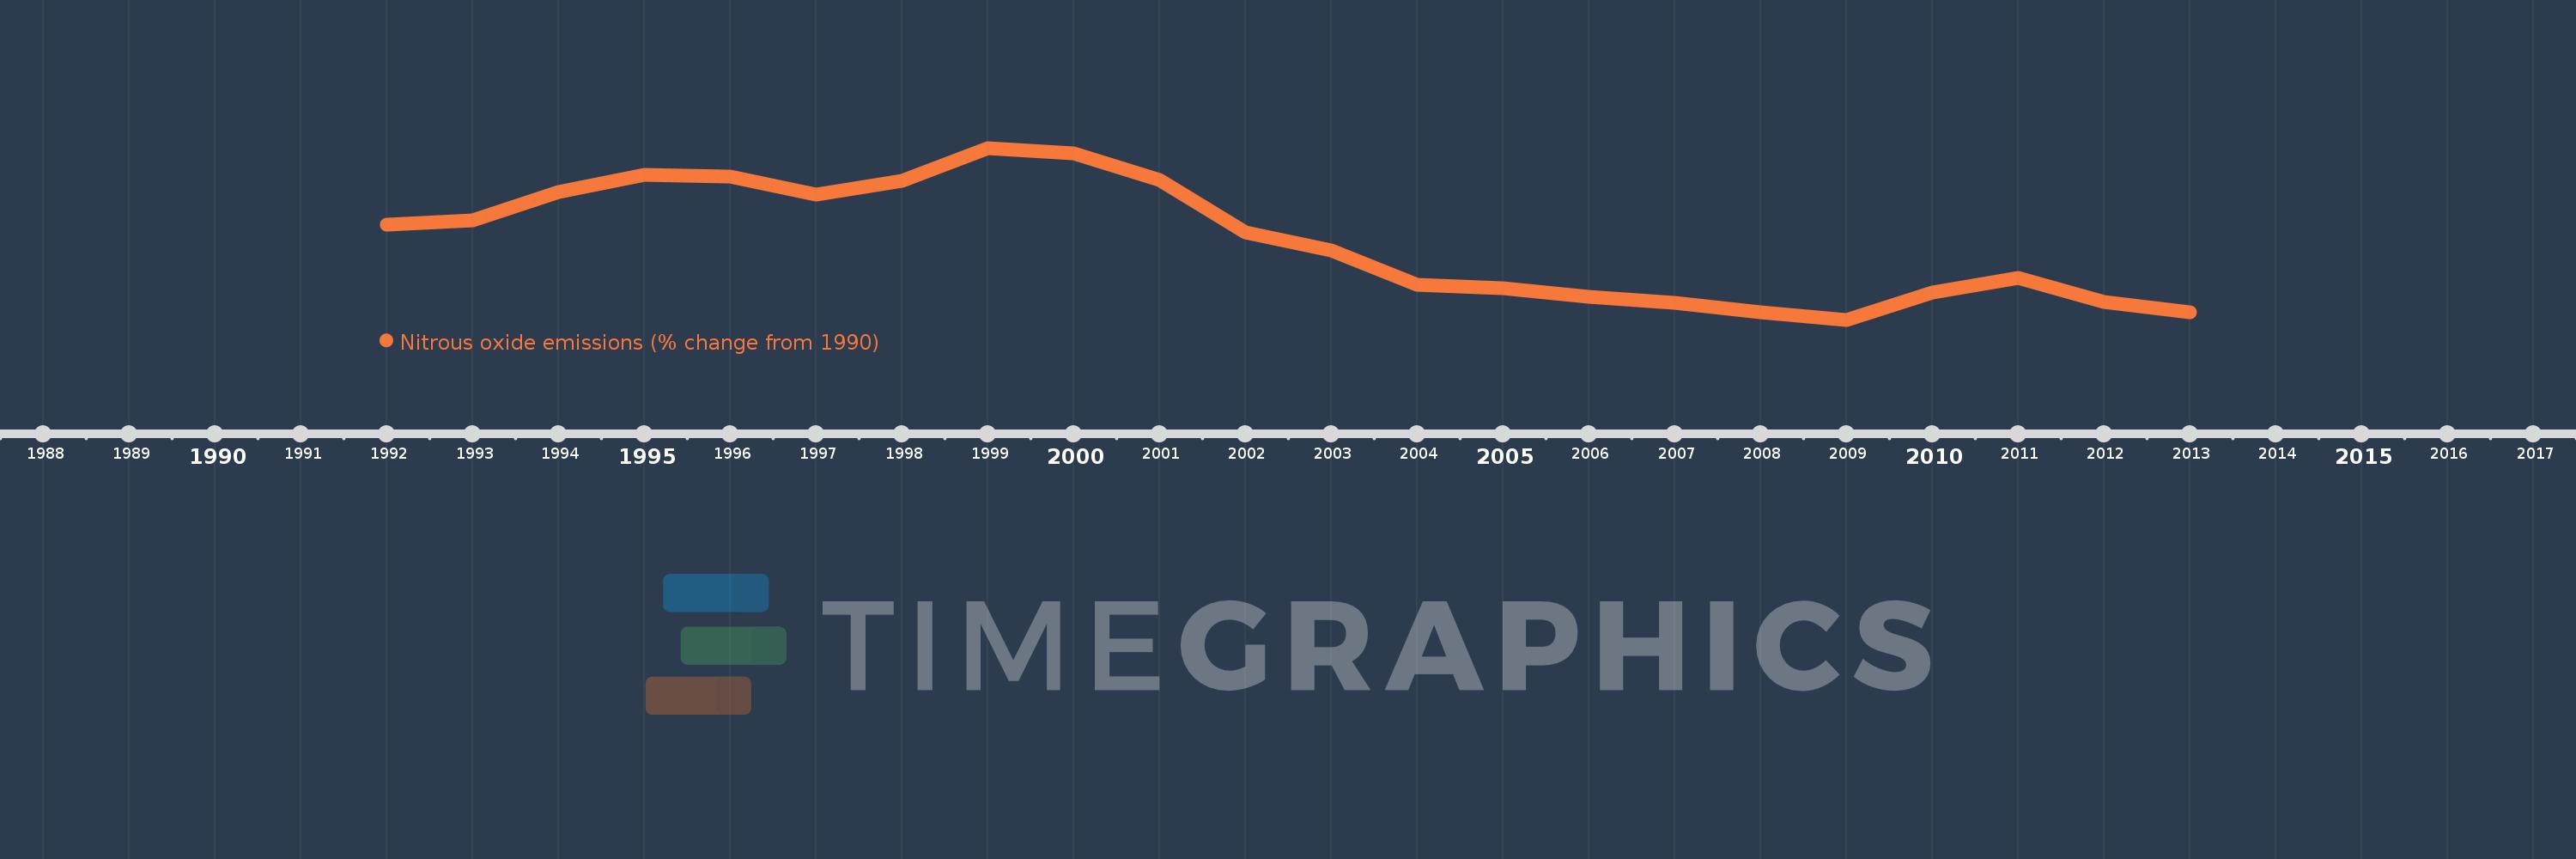
This timeline shows a graph from 1992 to 2013 of Ireland. No data until 1991. Number of actual observations by date: 22.
Source name:
World Development Indicators
Source organization:
World Bank staff estimates from original source: European Commission, Joint Research Centre (JRC)/Netherlands Environmental Assessment Agency (PBL). Emission Database for Global Atmospheric Research (EDGAR): http://edgar.jrc.ec.europa.eu/.
Categories, topics:
Climate Change, Environment
Last updated:
apr 23, 2017
Indicators value changes by year
Meaning:
-5.125
Minimum:
-16.159
jan 1, 2009
Maximum:
8.149
jan 1, 1999
At the date of observation
Value
Absolute change
Change from the previous value
jan 1, 1992
-2.74
-2.74
0.0%
jan 1, 1993
-2.102
+0.638
-23.28%
jan 1, 1994
1.857
+3.959
-188.34%
jan 1, 1995
4.294
+2.437
131.24%
jan 1, 1996
4.068
-0.226
-5.26%
jan 1, 1997
1.564
-2.504
-61.56%
jan 1, 1998
3.51
+1.946
124.44%
jan 1, 1999
8.149
+4.64
132.19%
jan 1, 2000
7.338
-0.811
-9.95%
jan 1, 2001
3.555
-3.784
-51.56%
jan 1, 2002
-3.741
-7.295
-205.23%
jan 1, 2003
-6.366
-2.626
70.19%
jan 1, 2004
-11.272
-4.906
77.06%
jan 1, 2005
-11.756
-0.483
4.29%
jan 1, 2006
-12.854
-1.098
9.34%
jan 1, 2007
-13.752
-0.898
6.99%
jan 1, 2008
-15.065
-1.313
9.55%
jan 1, 2009
-16.159
-1.094
7.26%
jan 1, 2010
-12.288
+3.87
-23.95%
jan 1, 2011
-10.248
+2.04
-16.6%
jan 1, 2012
-13.676
-3.428
33.45%
jan 1, 2013
-15.063
-1.387
10.14%
Ranking of countries by current statistics by years
