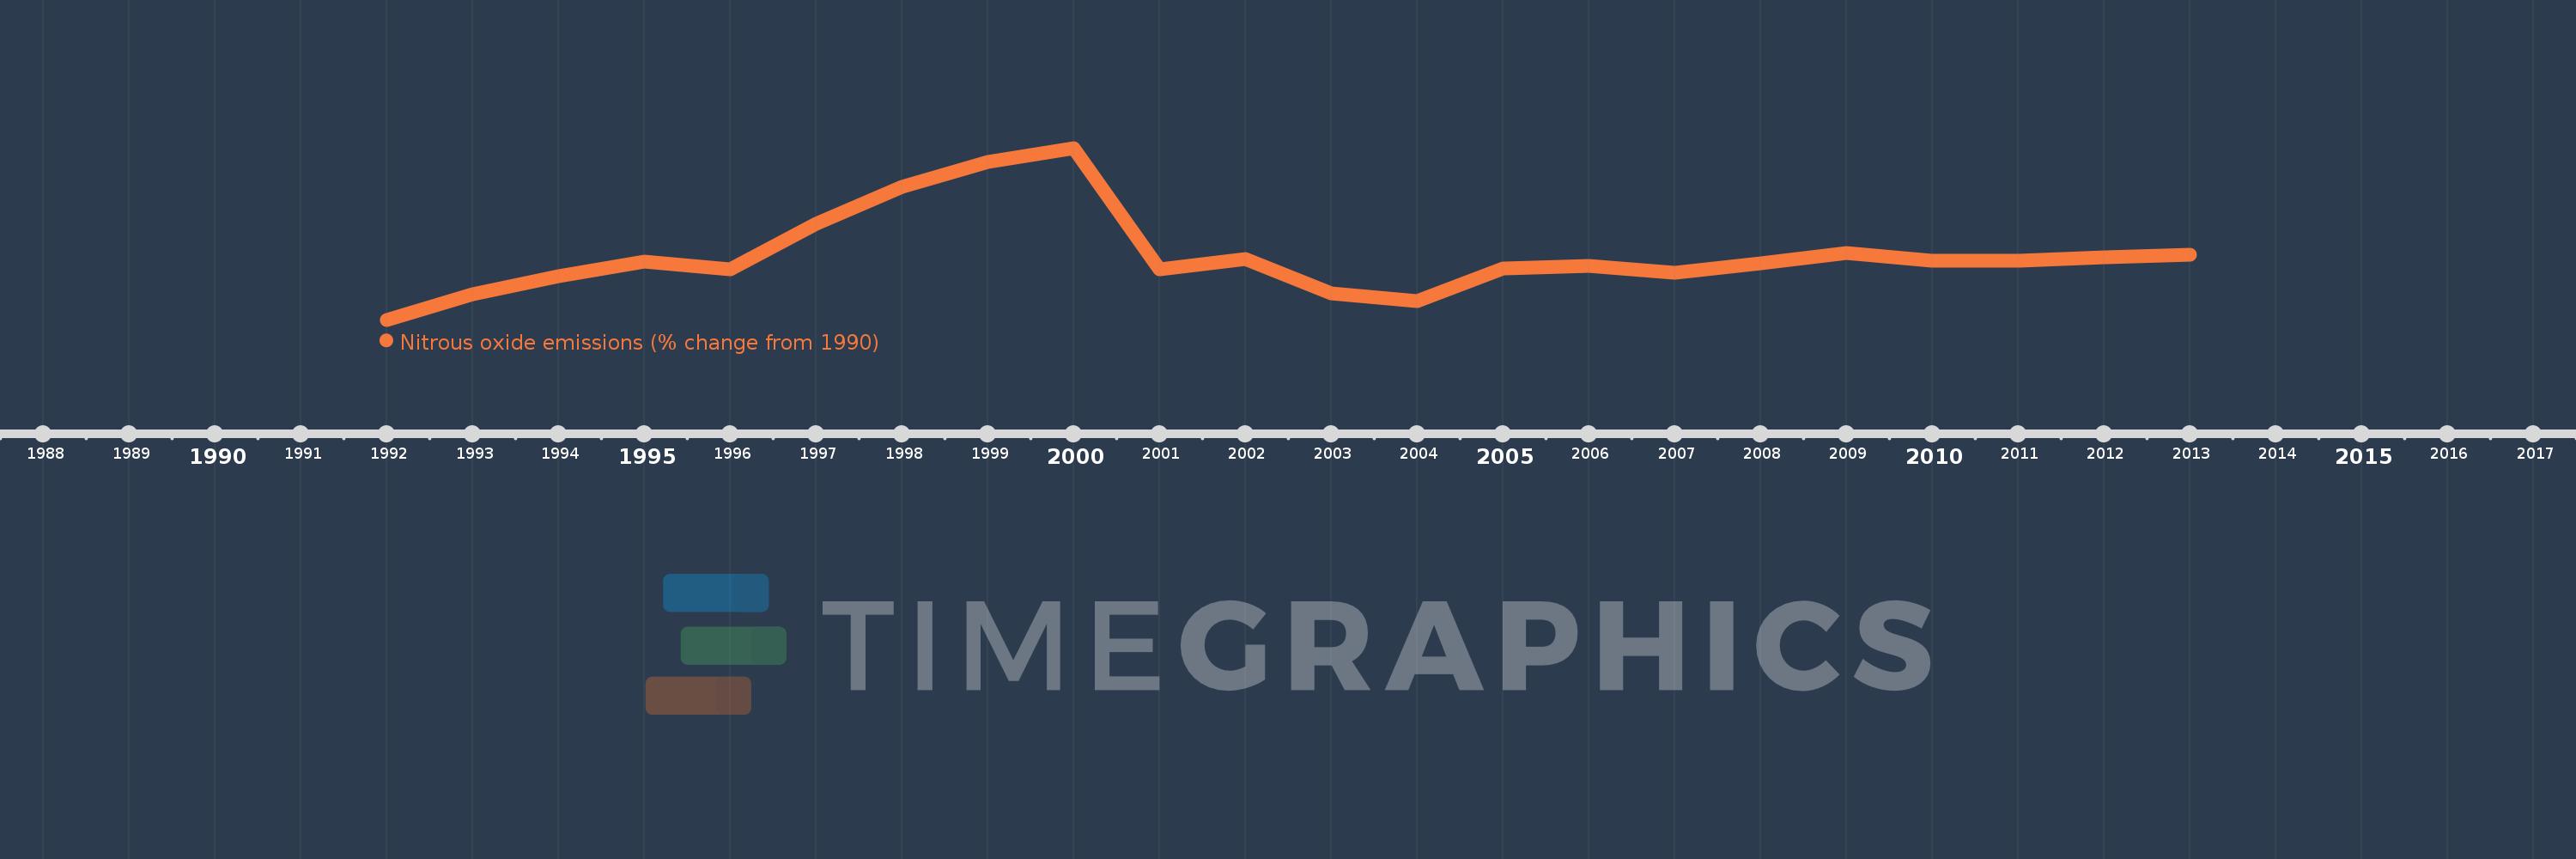
This timeline shows a graph from 1992 to 2013 of Macao SAR, China. No data until 1991. Number of actual observations by date: 22.
Source name:
World Development Indicators
Source organization:
World Bank staff estimates from original source: European Commission, Joint Research Centre (JRC)/Netherlands Environmental Assessment Agency (PBL). Emission Database for Global Atmospheric Research (EDGAR): http://edgar.jrc.ec.europa.eu/.
Categories, topics:
Climate Change, Environment
Last updated:
apr 23, 2017
Indicators value changes by year
Meaning:
26.545
Minimum:
-0.943
jan 1, 1992
Maximum:
72.473
jan 1, 2000
At the date of observation
Value
Absolute change
Change from the previous value
jan 1, 1992
-0.943
-0.943
0.0%
jan 1, 1993
10.087
+11.03
-1.17K%
jan 1, 1994
17.65
+7.564
74.98%
jan 1, 1995
24.082
+6.432
36.44%
jan 1, 1996
20.779
-3.303
-13.72%
jan 1, 1997
39.937
+19.157
92.2%
jan 1, 1998
56.007
+16.07
40.24%
jan 1, 1999
66.614
+10.607
18.94%
jan 1, 2000
72.473
+5.859
8.8%
jan 1, 2001
20.672
-51.801
-71.48%
jan 1, 2002
24.907
+4.236
20.49%
jan 1, 2003
10.389
-14.519
-58.29%
jan 1, 2004
7.163
-3.226
-31.05%
jan 1, 2005
21.125
+13.962
194.93%
jan 1, 2006
22.205
+1.079
5.11%
jan 1, 2007
19.054
-3.15
-14.19%
jan 1, 2008
23.018
+3.964
20.8%
jan 1, 2009
27.673
+4.655
20.22%
jan 1, 2010
24.24
-3.433
-12.41%
jan 1, 2011
24.373
+0.134
0.55%
jan 1, 2012
25.617
+1.244
5.1%
jan 1, 2013
26.861
+1.244
4.86%
Ranking of countries by current statistics by years
