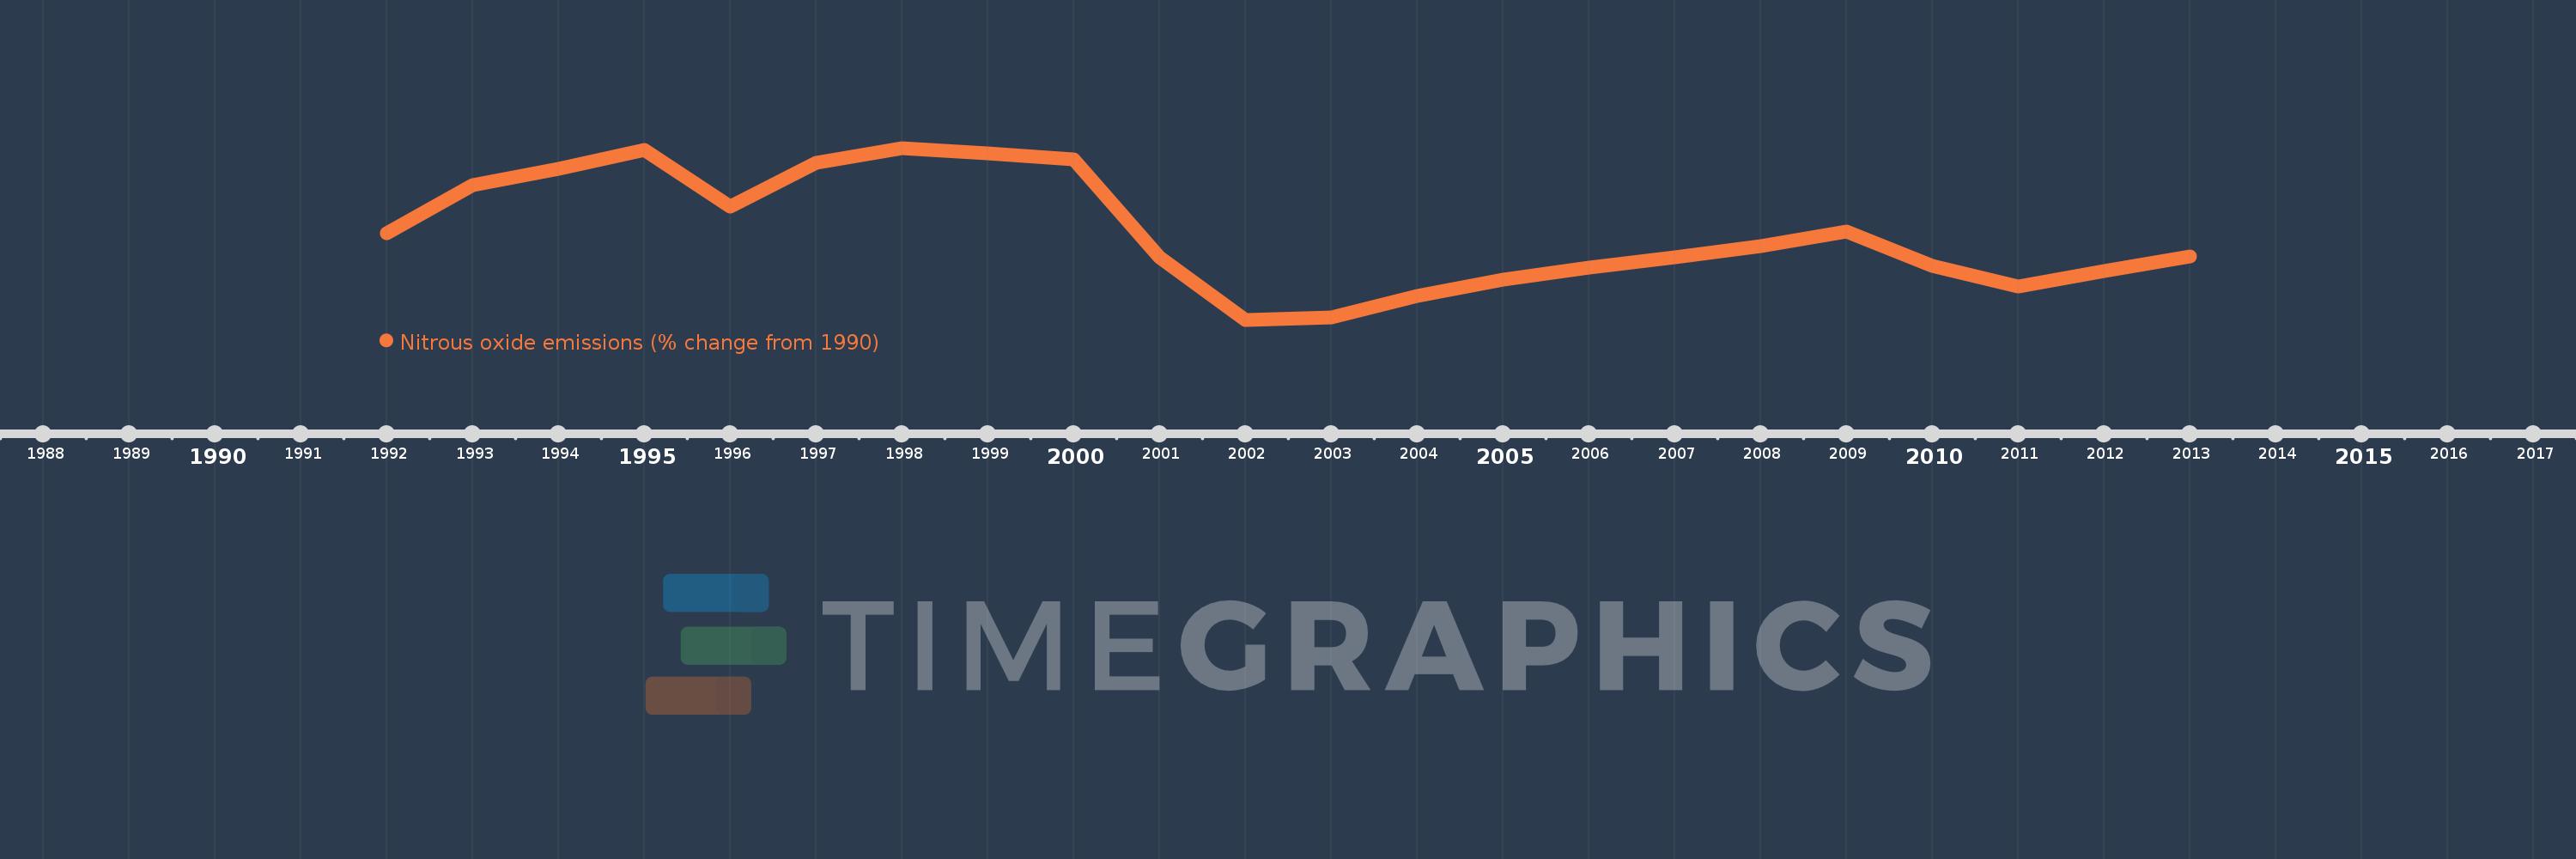
This timeline shows a graph from 1992 to 2013 of Saudi Arabia. No data until 1991. Number of actual observations by date: 22.
Source name:
World Development Indicators
Source organization:
World Bank staff estimates from original source: European Commission, Joint Research Centre (JRC)/Netherlands Environmental Assessment Agency (PBL). Emission Database for Global Atmospheric Research (EDGAR): http://edgar.jrc.ec.europa.eu/.
Categories, topics:
Climate Change, Environment
Last updated:
apr 23, 2017
Indicators value changes by year
Meaning:
5.085
Minimum:
-7.12
jan 1, 2002
Maximum:
16.956
jan 1, 1998
At the date of observation
Value
Absolute change
Change from the previous value
jan 1, 1992
5.01
+5.01
0.0%
jan 1, 1993
11.777
+6.768
135.09%
jan 1, 1994
14.004
+2.226
18.9%
jan 1, 1995
16.672
+2.668
19.05%
jan 1, 1996
8.769
-7.902
-47.4%
jan 1, 1997
14.917
+6.147
70.1%
jan 1, 1998
16.956
+2.039
13.67%
jan 1, 1999
16.214
-0.742
-4.38%
jan 1, 2000
15.328
-0.886
-5.46%
jan 1, 2001
1.659
-13.669
-89.17%
jan 1, 2002
-7.12
-8.779
-529.03%
jan 1, 2003
-6.776
+0.343
-4.82%
jan 1, 2004
-3.845
+2.932
-43.26%
jan 1, 2005
-1.492
+2.353
-61.19%
jan 1, 2006
0.189
+1.681
-112.65%
jan 1, 2007
1.613
+1.424
754.1%
jan 1, 2008
3.237
+1.624
100.72%
jan 1, 2009
5.292
+2.055
63.51%
jan 1, 2010
0.441
-4.852
-91.68%
jan 1, 2011
-2.42
-2.861
-649.34%
jan 1, 2012
-0.322
+2.098
-86.69%
jan 1, 2013
1.776
+2.098
-651.53%
Ranking of countries by current statistics by years
