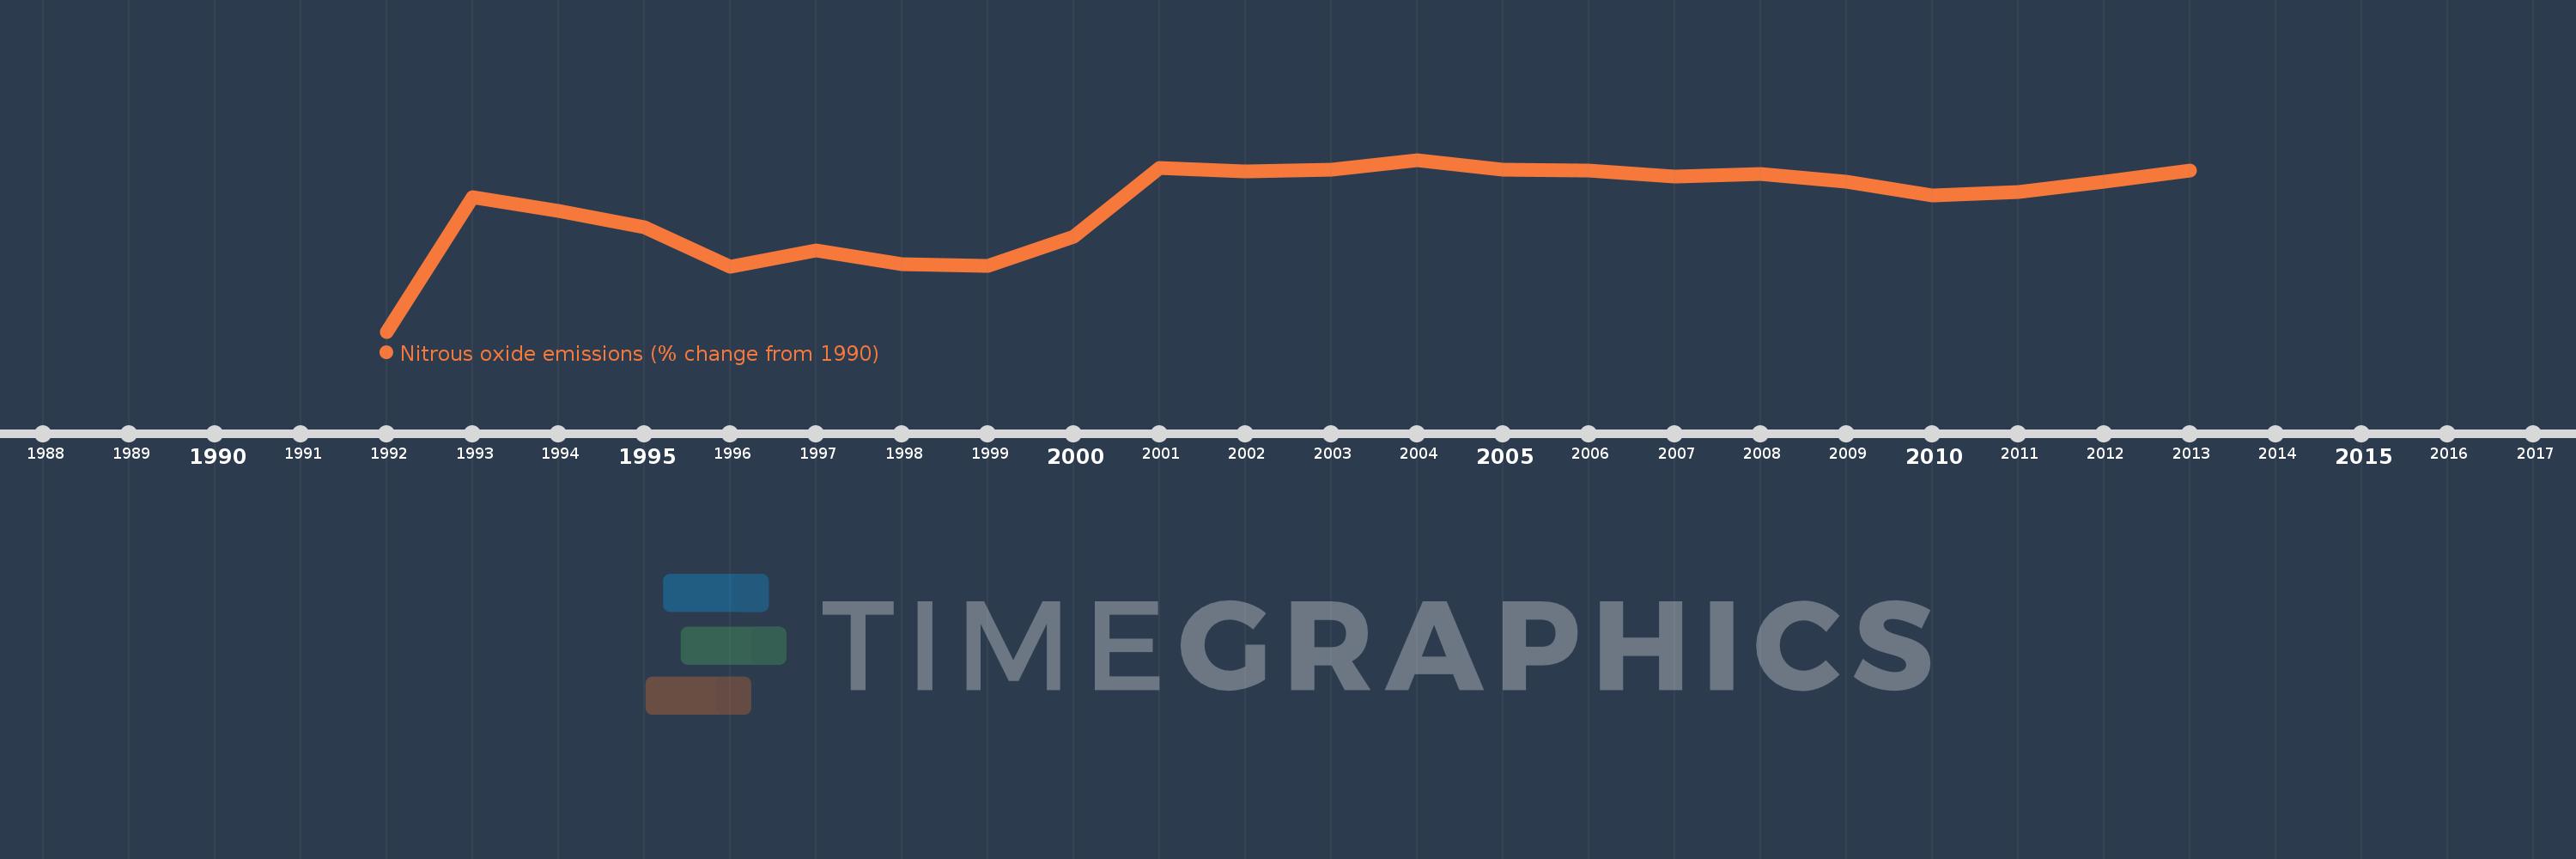
This timeline shows a graph from 1992 to 2013 of Tonga. No data until 1991. Number of actual observations by date: 22.
Source name:
World Development Indicators
Source organization:
World Bank staff estimates from original source: European Commission, Joint Research Centre (JRC)/Netherlands Environmental Assessment Agency (PBL). Emission Database for Global Atmospheric Research (EDGAR): http://edgar.jrc.ec.europa.eu/.
Categories, topics:
Climate Change, Environment
Last updated:
apr 23, 2017
Indicators value changes by year
Meaning:
11.186
Minimum:
-1.719
jan 1, 1992
Maximum:
15.928
jan 1, 2004
At the date of observation
Value
Absolute change
Change from the previous value
jan 1, 1992
-1.719
-1.719
0.0%
jan 1, 1993
12.089
+13.809
-803.19%
jan 1, 1994
10.693
-1.396
-11.55%
jan 1, 1995
8.968
-1.725
-16.13%
jan 1, 1996
4.932
-4.037
-45.01%
jan 1, 1997
6.596
+1.664
33.75%
jan 1, 1998
5.2
-1.396
-21.17%
jan 1, 1999
4.988
-0.212
-4.07%
jan 1, 2000
8.036
+3.048
61.1%
jan 1, 2001
15.117
+7.08
88.1%
jan 1, 2002
14.717
-0.4
-2.64%
jan 1, 2003
14.893
+0.176
1.2%
jan 1, 2004
15.928
+1.034
6.95%
jan 1, 2005
14.922
-1.006
-6.32%
jan 1, 2006
14.859
-0.063
-0.42%
jan 1, 2007
14.233
-0.626
-4.21%
jan 1, 2008
14.513
+0.28
1.97%
jan 1, 2009
13.704
-0.808
-5.57%
jan 1, 2010
12.293
-1.412
-10.3%
jan 1, 2011
12.585
+0.293
2.38%
jan 1, 2012
13.711
+1.126
8.95%
jan 1, 2013
14.837
+1.126
8.21%
Ranking of countries by current statistics by years
