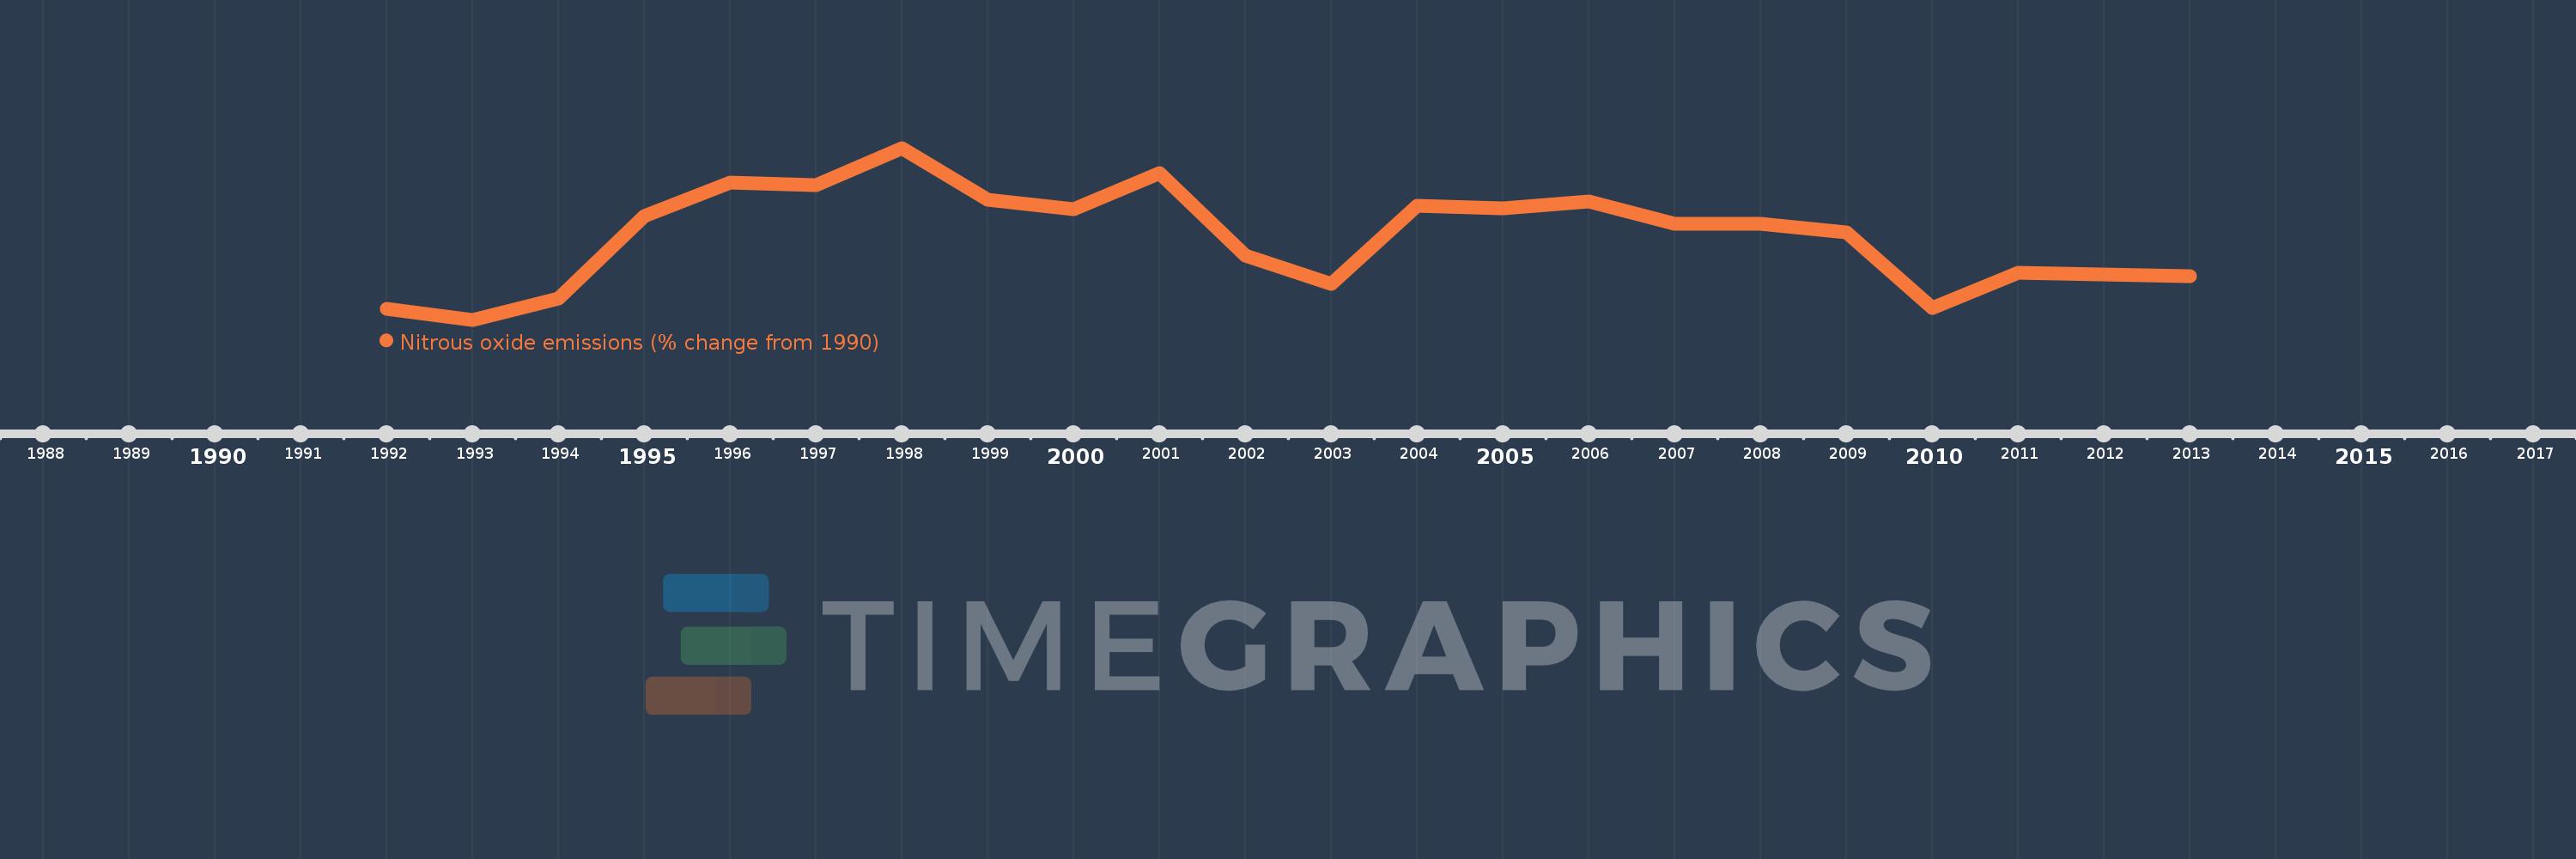
This timeline shows a graph from 1992 to 2013 of Poland. No data until 1991. Number of actual observations by date: 22.
Source name:
World Development Indicators
Source organization:
World Bank staff estimates from original source: European Commission, Joint Research Centre (JRC)/Netherlands Environmental Assessment Agency (PBL). Emission Database for Global Atmospheric Research (EDGAR): http://edgar.jrc.ec.europa.eu/.
Categories, topics:
Climate Change, Environment
Last updated:
apr 23, 2017
Indicators value changes by year
Meaning:
-4.669
Minimum:
-12.98
jan 1, 1993
Maximum:
4.226
jan 1, 1998
At the date of observation
Value
Absolute change
Change from the previous value
jan 1, 1992
-11.91
-11.91
0.0%
jan 1, 1993
-12.98
-1.07
8.98%
jan 1, 1994
-10.845
+2.136
-16.45%
jan 1, 1995
-2.587
+8.258
-76.15%
jan 1, 1996
0.719
+3.306
-127.79%
jan 1, 1997
0.459
-0.26
-36.1%
jan 1, 1998
4.226
+3.766
819.77%
jan 1, 1999
-0.969
-5.194
-122.92%
jan 1, 2000
-1.872
-0.904
93.31%
jan 1, 2001
1.72
+3.592
-191.87%
jan 1, 2002
-6.558
-8.278
-481.24%
jan 1, 2003
-9.394
-2.836
43.25%
jan 1, 2004
-1.573
+7.821
-83.25%
jan 1, 2005
-1.856
-0.282
17.94%
jan 1, 2006
-1.167
+0.689
-37.13%
jan 1, 2007
-3.391
-2.225
190.71%
jan 1, 2008
-3.355
+0.036
-1.07%
jan 1, 2009
-4.231
-0.876
26.1%
jan 1, 2010
-11.8
-7.569
178.91%
jan 1, 2011
-8.257
+3.543
-30.02%
jan 1, 2012
-8.452
-0.195
2.36%
jan 1, 2013
-8.647
-0.195
2.31%
Ranking of countries by current statistics by years
