29
/
en
AIzaSyAYiBZKx7MnpbEhh9jyipgxe19OcubqV5w
April 1, 2024
249091
Sri Lanka
LKA
true
2
1
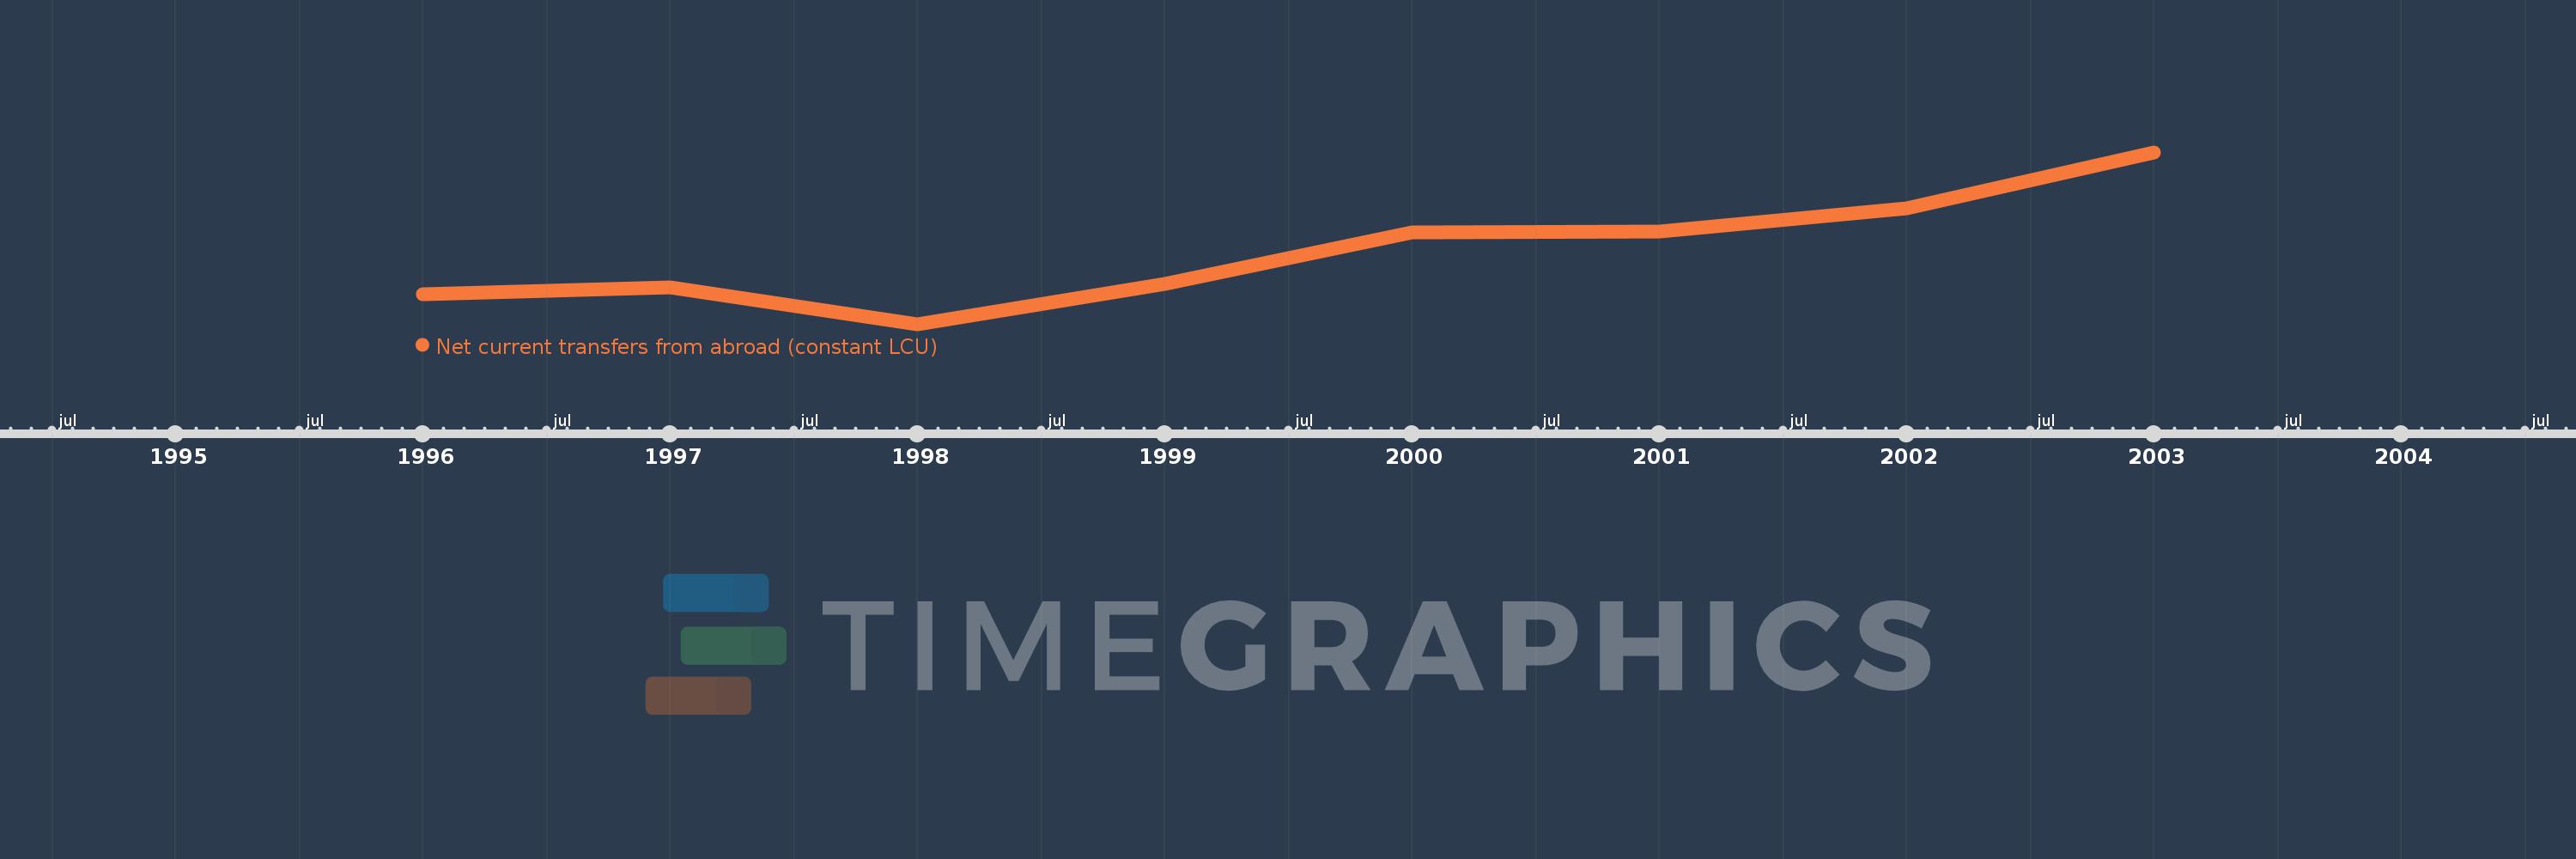
Net current transfers from abroad (constant LCU)
2003,2002,2001,2000,1999,1998,1997,1996
This statistics in other country:
Timeline:
This timeline shows a graph from 1996 to 2003 of Sri Lanka. No data until 1995. Number of actual observations by date: 8.
Source name:
World Development Indicators
Source organization:
World Bank national accounts data, and OECD National Accounts data files.
Categories, topics:
Economy & Growth
Last updated:
apr 23, 2017
Indicators value changes by year
Minimum:
70.335 bln
jan 1, 1998
Maximum:
104.981 bln
jan 1, 2003
At the date of observation
Value
Absolute change
Change from previous value
jan 1, 1996
76.296 bln
+76.296 bln
0.0%
jan 1, 1997
77.847 bln
+1.55 bln
2.03%
jan 1, 1998
70.335 bln
-7.512 bln
-9.65%
jan 1, 1999
78.433 bln
+8.098 bln
11.51%
jan 1, 2000
88.809 bln
+10.376 bln
13.23%
jan 1, 2001
89.068 bln
+258.642 mln
0.29%
jan 1, 2002
93.773 bln
+4.705 bln
5.28%
jan 1, 2003
104.981 bln
+11.208 bln
11.95%
Ranking of countries by current statistics by years


Comments: