29
/
en
AIzaSyAYiBZKx7MnpbEhh9jyipgxe19OcubqV5w
April 1, 2024
65079
Albania
ALB
true
2
1
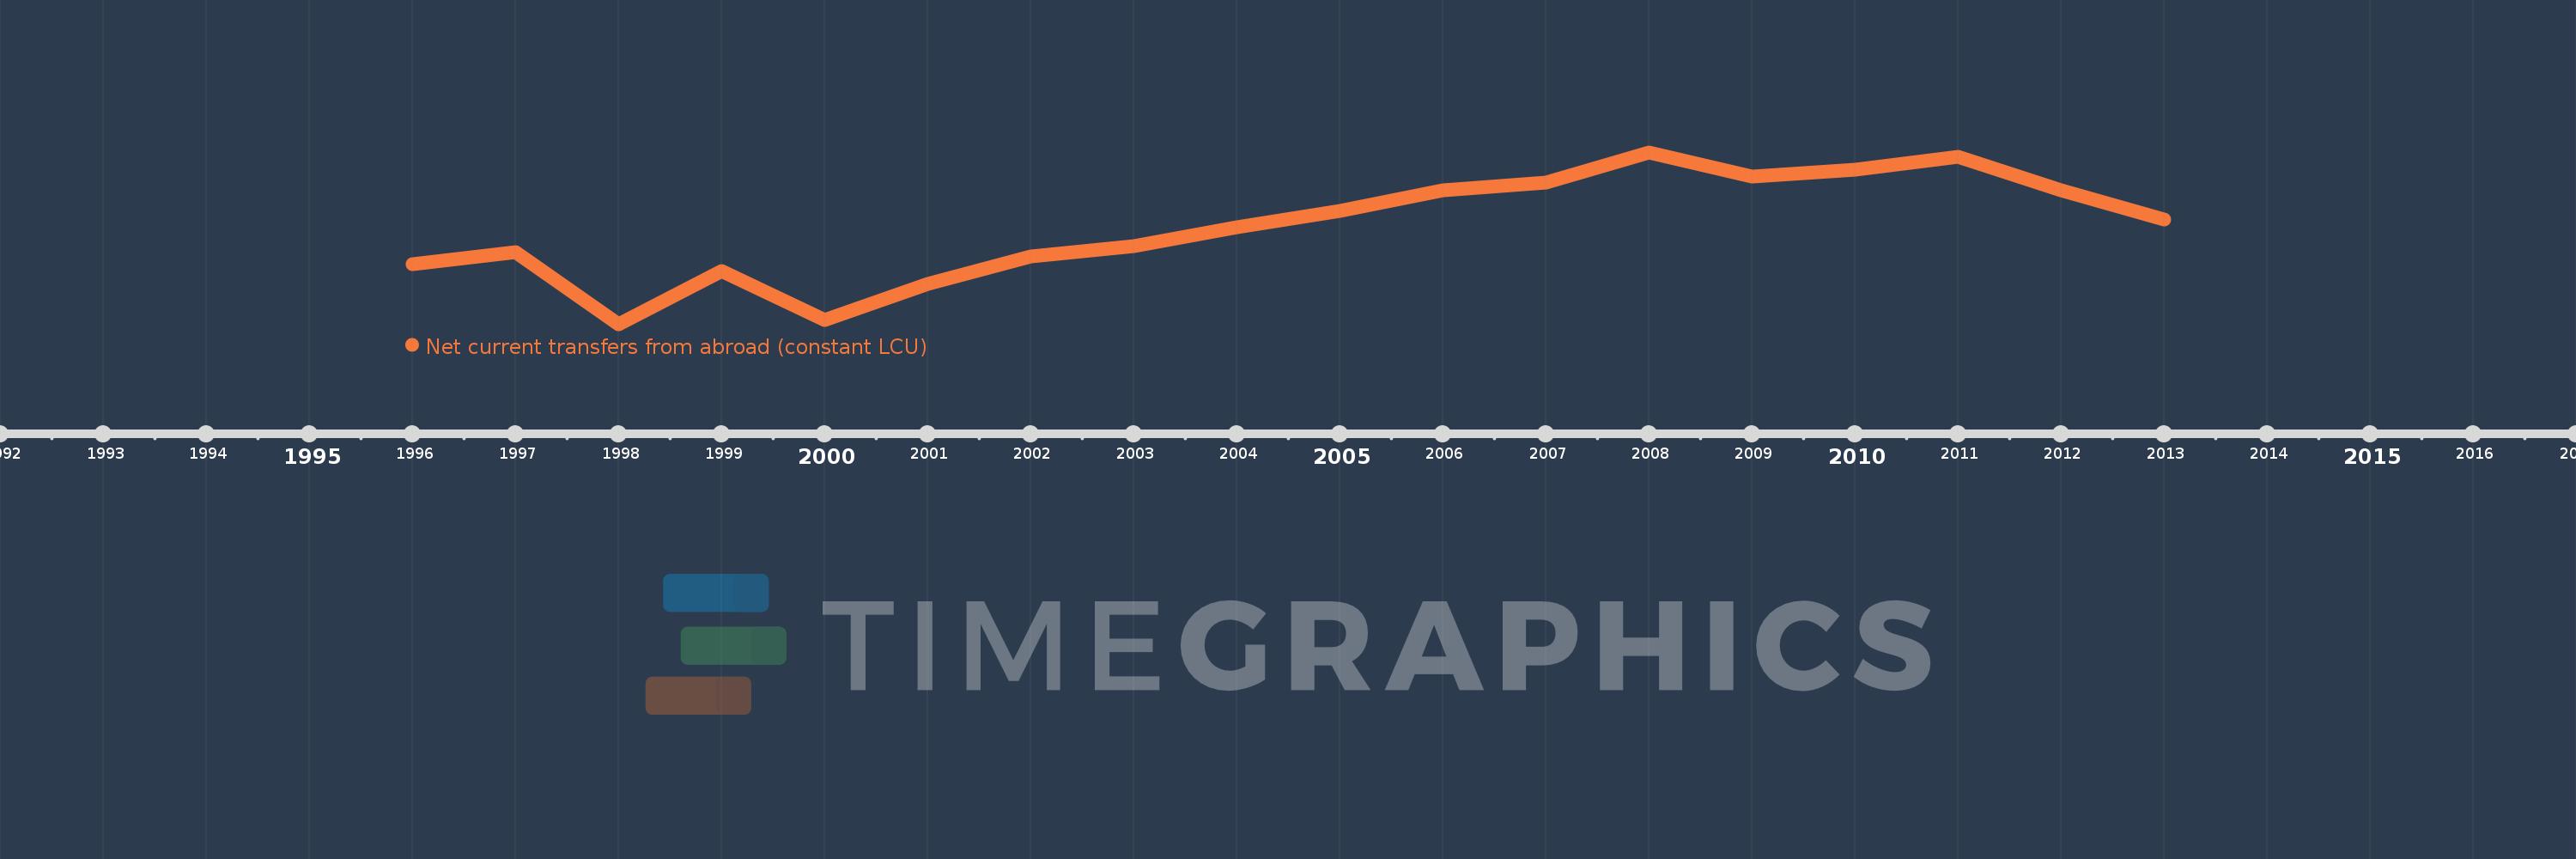
Net current transfers from abroad (constant LCU)
2013,2012,2011,2010,2009,2008,2007,2006,2005,2004,2003,2002,2001,2000,1999,1998,1997,1996
This statistics in other country:
Timeline:
This timeline shows a graph from 1996 to 2013 of Albania. No data until 1995. Number of actual observations by date: 18.
Source name:
World Development Indicators
Source organization:
World Bank national accounts data, and OECD National Accounts data files.
Categories, topics:
Economy & Growth
Last updated:
apr 23, 2017
Indicators value changes by year
Minimum:
33.302 bln
jan 1, 1998
Maximum:
93.402 bln
jan 1, 2008
At the date of observation
Value
Absolute change
Change from previous value
jan 1, 1996
54.456 bln
+54.456 bln
0.0%
jan 1, 1997
58.457 bln
+4.0 bln
7.35%
jan 1, 1998
33.302 bln
-25.155 bln
-43.03%
jan 1, 1999
51.832 bln
+18.531 bln
55.64%
jan 1, 2000
34.706 bln
-17.127 bln
-33.04%
jan 1, 2001
47.324 bln
+12.618 bln
36.36%
jan 1, 2002
56.915 bln
+9.591 bln
20.27%
jan 1, 2003
60.57 bln
+3.655 bln
6.42%
jan 1, 2004
67.238 bln
+6.668 bln
11.01%
jan 1, 2005
72.901 bln
+5.663 bln
8.42%
jan 1, 2006
80.198 bln
+7.297 bln
10.01%
jan 1, 2007
82.997 bln
+2.8 bln
3.49%
jan 1, 2008
93.402 bln
+10.404 bln
12.54%
jan 1, 2009
85.012 bln
-8.39 bln
-8.98%
jan 1, 2010
87.405 bln
+2.393 bln
2.81%
jan 1, 2011
91.724 bln
+4.32 bln
4.94%
jan 1, 2012
80.151 bln
-11.573 bln
-12.62%
jan 1, 2013
69.843 bln
-10.309 bln
-12.86%
Ranking of countries by current statistics by years


Comments: