This statistics in other country:
Timeline:
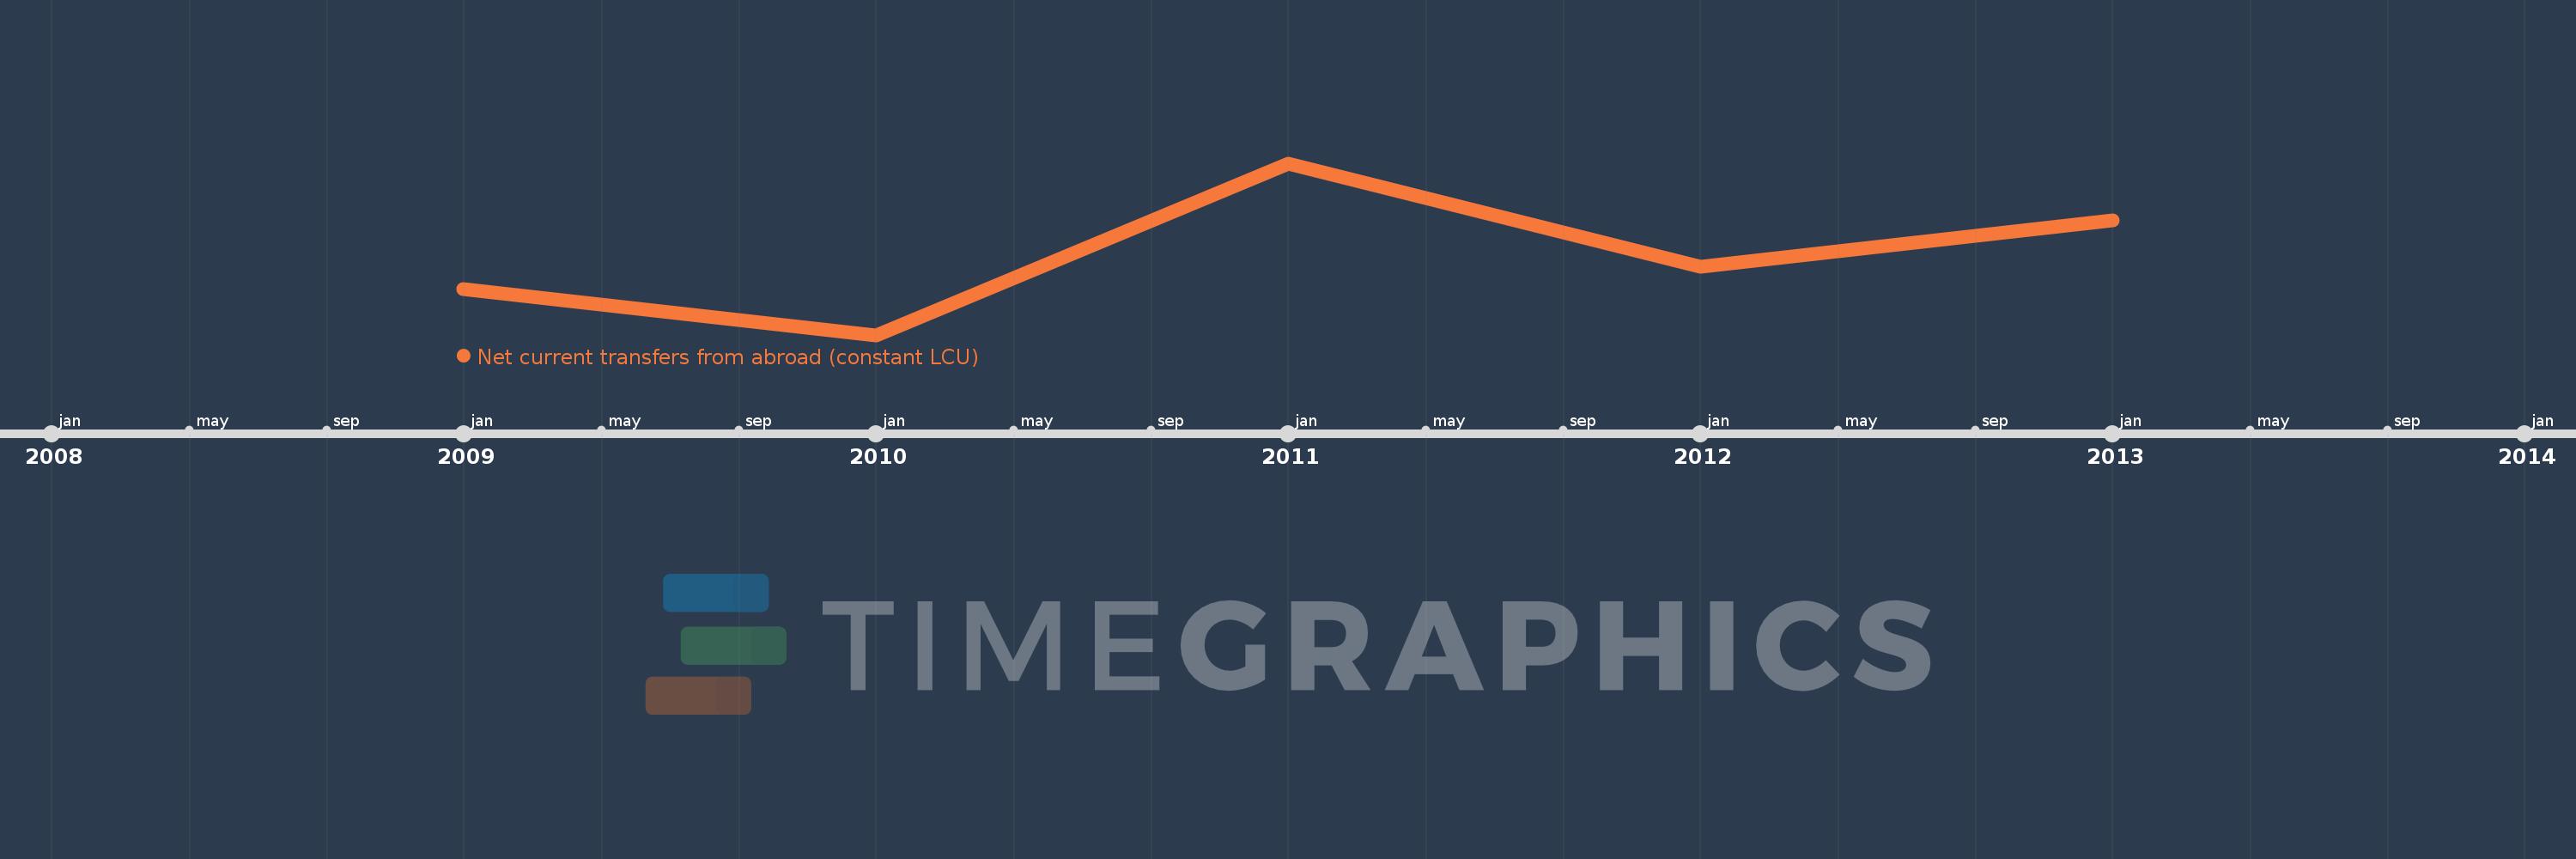
This timeline shows a graph from 2009 to 2013 of Niger. No data until 2008. Number of actual observations by date: 5.
Source name:
World Development Indicators
Source organization:
World Bank national accounts data, and OECD National Accounts data files.
Categories, topics:
Economy & Growth
Last updated:
apr 23, 2017
Indicators value changes by year
Minimum:
59.791 bln
jan 1, 2010
Maximum:
179.757 bln
jan 1, 2011
At the date of observation
Value
Absolute change
Change from previous value
jan 1, 2009
92.038 bln
+92.038 bln
0.0%
jan 1, 2010
59.791 bln
-32.247 bln
-35.04%
jan 1, 2011
179.757 bln
+119.966 bln
200.64%
jan 1, 2012
107.523 bln
-72.235 bln
-40.18%
jan 1, 2013
139.781 bln
+32.258 bln
30.0%
Ranking of countries by current statistics by years


Comments: