29
/
en
AIzaSyAYiBZKx7MnpbEhh9jyipgxe19OcubqV5w
April 1, 2024
200711
Montenegro
MNE
true
2
1
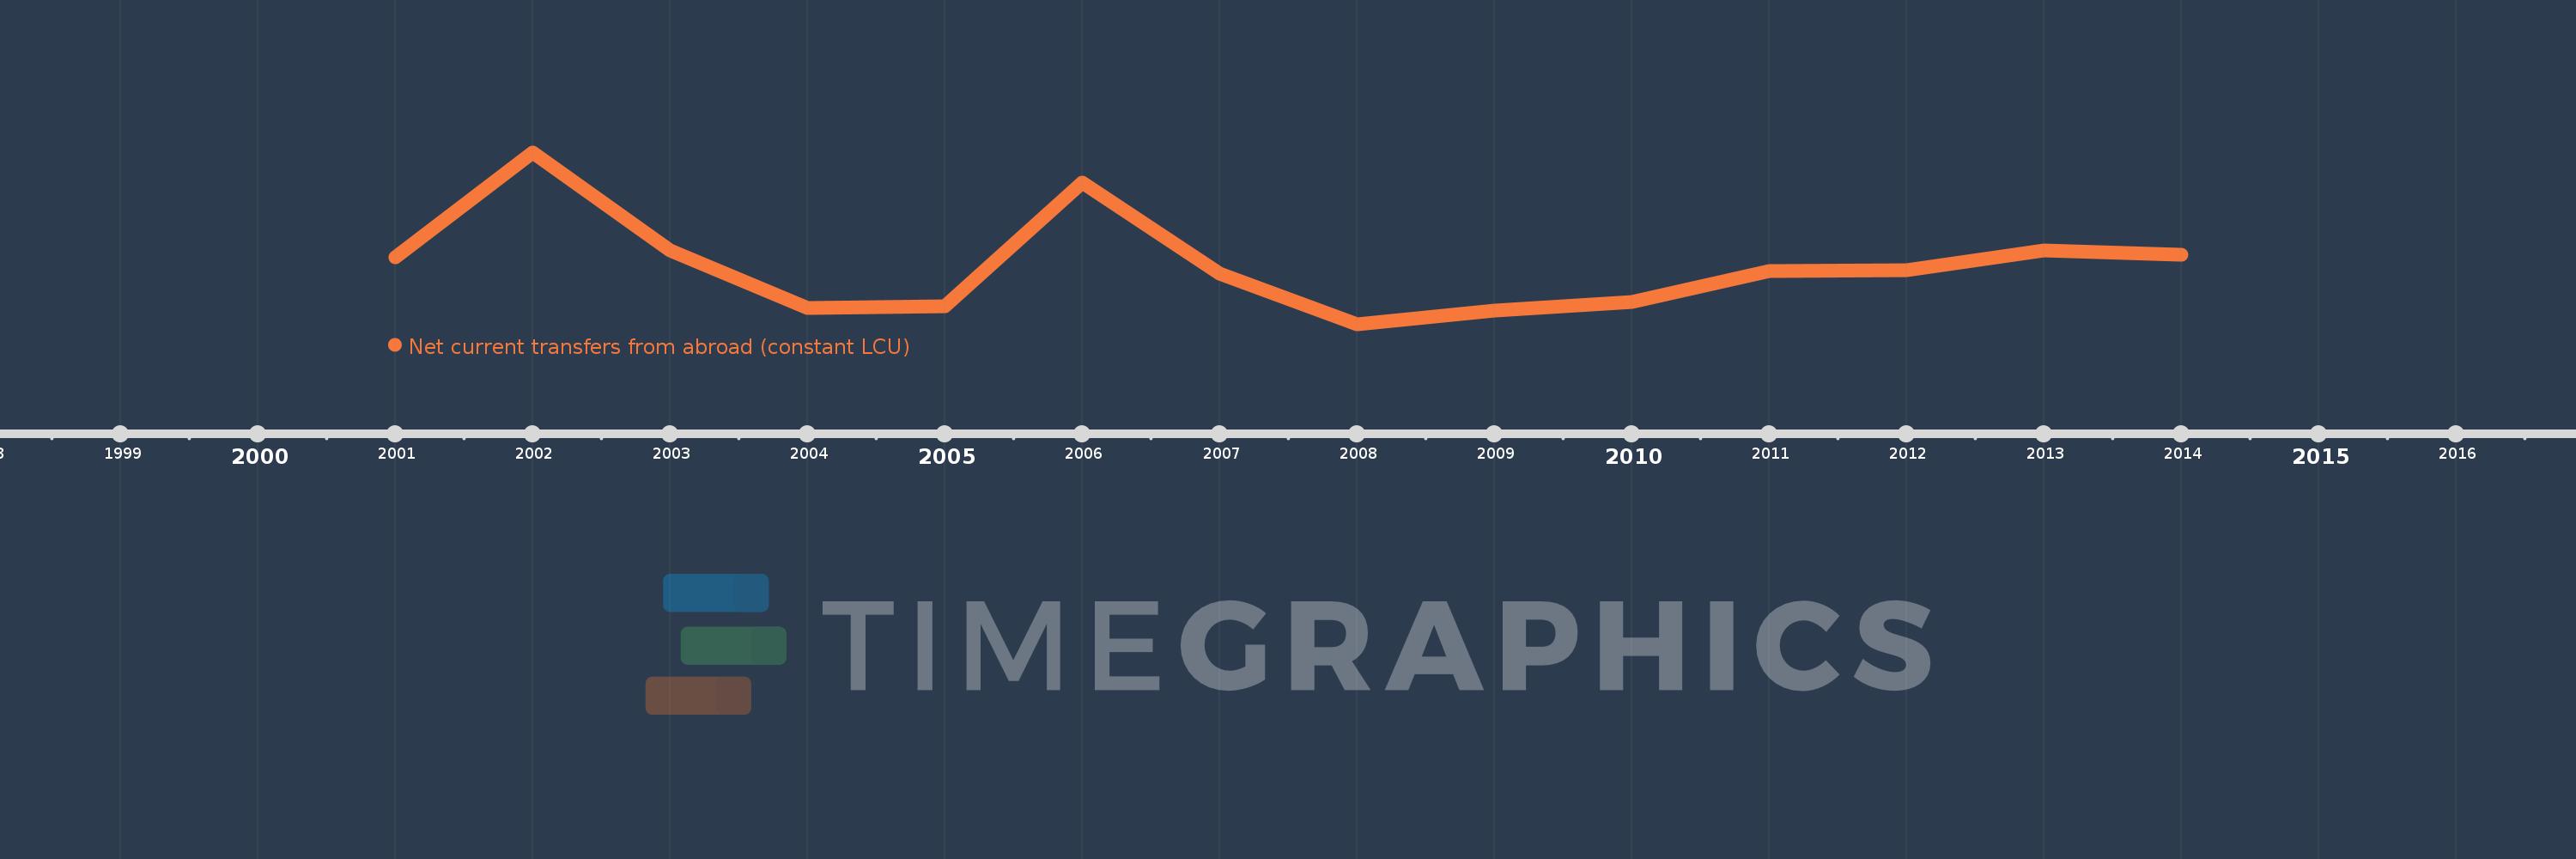
Net current transfers from abroad (constant LCU)
2014,2013,2012,2011,2010,2009,2008,2007,2006,2005,2004,2003,2002,2001
This statistics in other country:
Timeline:
This timeline shows a graph from 2001 to 2014 of Montenegro. No data until 2000. Number of actual observations by date: 14.
Source name:
World Development Indicators
Source organization:
World Bank national accounts data, and OECD National Accounts data files.
Categories, topics:
Economy & Growth
Last updated:
apr 23, 2017
Indicators value changes by year
Minimum:
37.239 mln
jan 1, 2008
Maximum:
119.166 mln
jan 1, 2002
At the date of observation
Value
Absolute change
Change from previous value
jan 1, 2001
69.27 mln
+69.27 mln
0.0%
jan 1, 2002
119.166 mln
+49.895 mln
72.03%
jan 1, 2003
72.47 mln
-46.695 mln
-39.19%
jan 1, 2004
44.896 mln
-27.575 mln
-38.05%
jan 1, 2005
45.996 mln
+1.101 mln
2.45%
jan 1, 2006
104.714 mln
+58.717 mln
127.66%
jan 1, 2007
61.447 mln
-43.267 mln
-41.32%
jan 1, 2008
37.239 mln
-24.207 mln
-39.4%
jan 1, 2009
43.915 mln
+6.676 mln
17.93%
jan 1, 2010
48.012 mln
+4.097 mln
9.33%
jan 1, 2011
62.717 mln
+14.705 mln
30.63%
jan 1, 2012
62.835 mln
+118.61K
0.19%
jan 1, 2013
72.597 mln
+9.762 mln
15.54%
jan 1, 2014
70.343 mln
-2.254 mln
-3.1%
Ranking of countries by current statistics by years


Comments: