29
/
en
AIzaSyAYiBZKx7MnpbEhh9jyipgxe19OcubqV5w
April 1, 2024
259938
Tajikistan
TJK
true
2
1
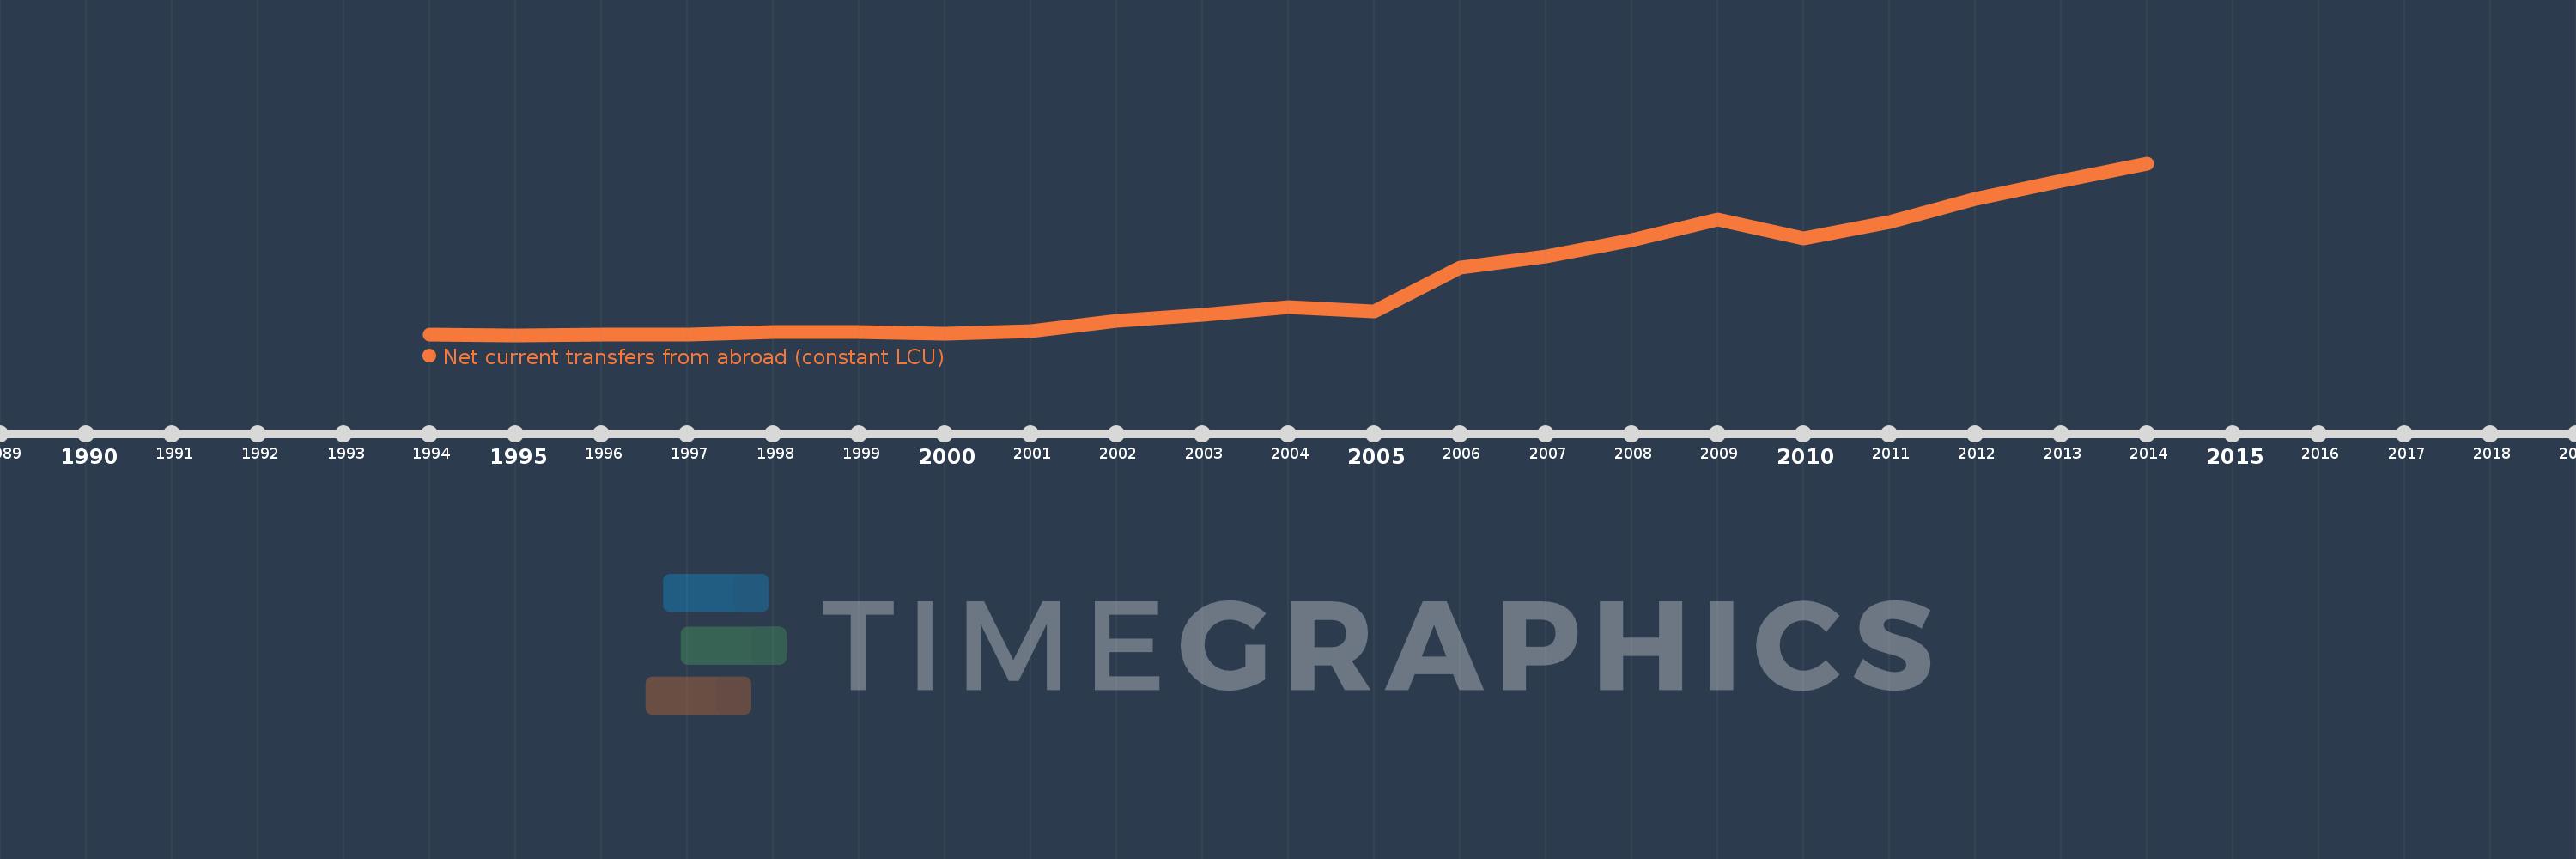
Net current transfers from abroad (constant LCU)
2014,2013,2012,2011,2010,2009,2008,2007,2006,2005,2004,2003,2002,2001,2000,1999,1998,1997,1996,1995,1994
This statistics in other country:
Timeline:
This timeline shows a graph from 1994 to 2014 of Tajikistan. No data until 1993. Number of actual observations by date: 21.
Source name:
World Development Indicators
Source organization:
World Bank national accounts data, and OECD National Accounts data files.
Categories, topics:
Economy & Growth
Last updated:
apr 23, 2017
Indicators value changes by year
Minimum:
37.411 mln
jan 1, 1995
Maximum:
1.779 bln
jan 1, 2014
At the date of observation
Value
Absolute change
Change from previous value
jan 1, 1994
44.588 mln
+44.588 mln
0.0%
jan 1, 1995
37.411 mln
-7.177 mln
-16.1%
jan 1, 1996
38.75 mln
+1.34 mln
3.58%
jan 1, 1997
38.895 mln
+144.81K
0.37%
jan 1, 1998
70.16 mln
+31.265 mln
80.38%
jan 1, 1999
71.622 mln
+1.462 mln
2.08%
jan 1, 2000
50.067 mln
-21.555 mln
-30.1%
jan 1, 2001
78.203 mln
+28.136 mln
56.2%
jan 1, 2002
185.377 mln
+107.175 mln
137.05%
jan 1, 2003
241.658 mln
+56.28 mln
30.36%
jan 1, 2004
324.052 mln
+82.394 mln
34.1%
jan 1, 2005
280.811 mln
-43.241 mln
-13.34%
jan 1, 2006
717.231 mln
+436.42 mln
155.41%
jan 1, 2007
830.781 mln
+113.551 mln
15.83%
jan 1, 2008
996.506 mln
+165.725 mln
19.95%
jan 1, 2009
1.21 bln
+213.323 mln
21.41%
jan 1, 2010
1.013 bln
-196.475 mln
-16.24%
jan 1, 2011
1.183 bln
+169.22 mln
16.7%
jan 1, 2012
1.414 bln
+231.541 mln
19.58%
jan 1, 2013
1.599 bln
+184.414 mln
13.04%
jan 1, 2014
1.779 bln
+180.134 mln
11.27%
Ranking of countries by current statistics by years


Comments: