This statistics in other country:
Timeline:
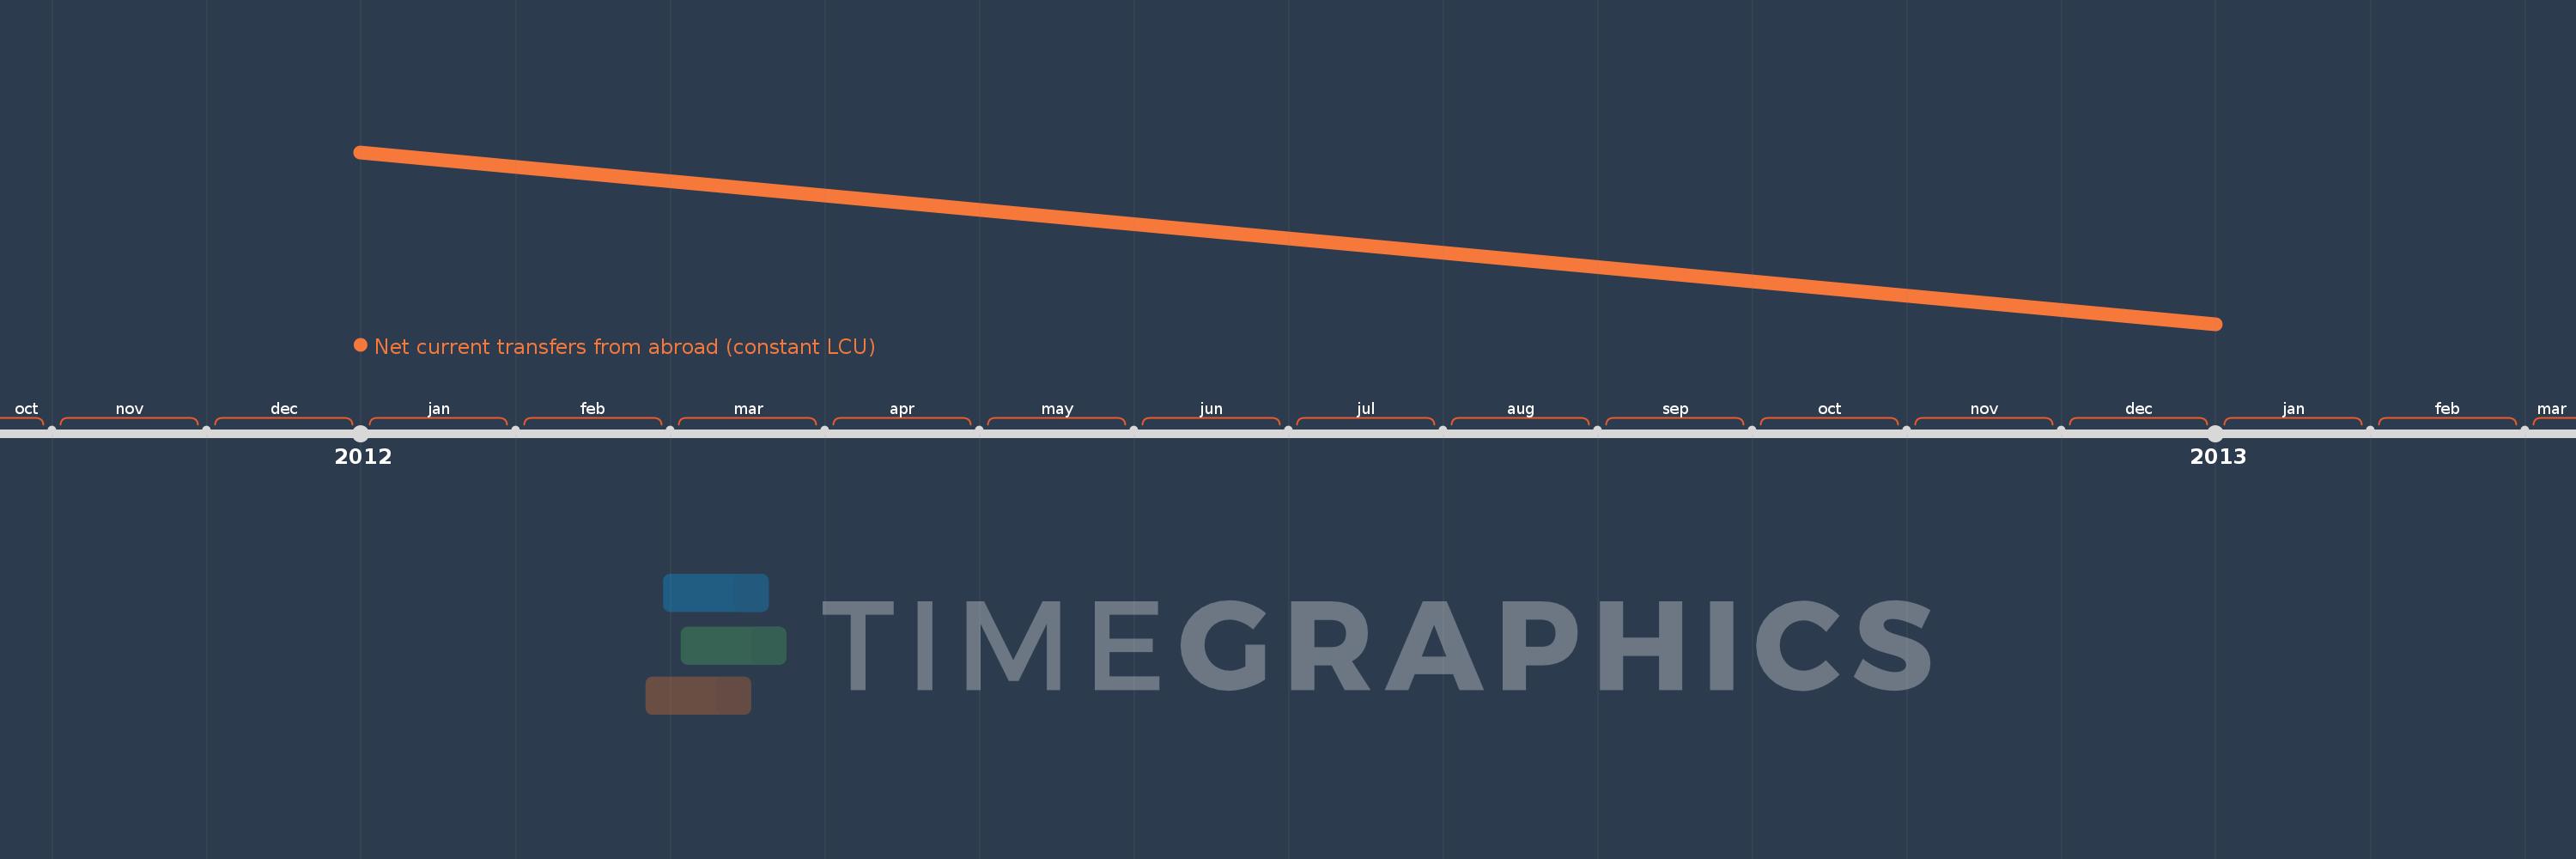
This timeline shows a graph from 2012 to 2013 of South Sudan. No data until 2011. Number of actual observations by date: 2.
Source name:
World Development Indicators
Source organization:
World Bank national accounts data, and OECD National Accounts data files.
Categories, topics:
Economy & Growth
Last updated:
apr 23, 2017
Indicators value changes by year
Minimum:
1.574 bln
jan 1, 2013
Maximum:
1.853 bln
jan 1, 2012
At the date of observation
Value
Absolute change
Change from previous value
jan 1, 2012
1.853 bln
+1.853 bln
0.0%
jan 1, 2013
1.574 bln
-278.154 mln
-15.01%
Ranking of countries by current statistics by years


Comments: