29
/
en
AIzaSyAYiBZKx7MnpbEhh9jyipgxe19OcubqV5w
April 1, 2024
221198
Paraguay
PRY
true
2
1
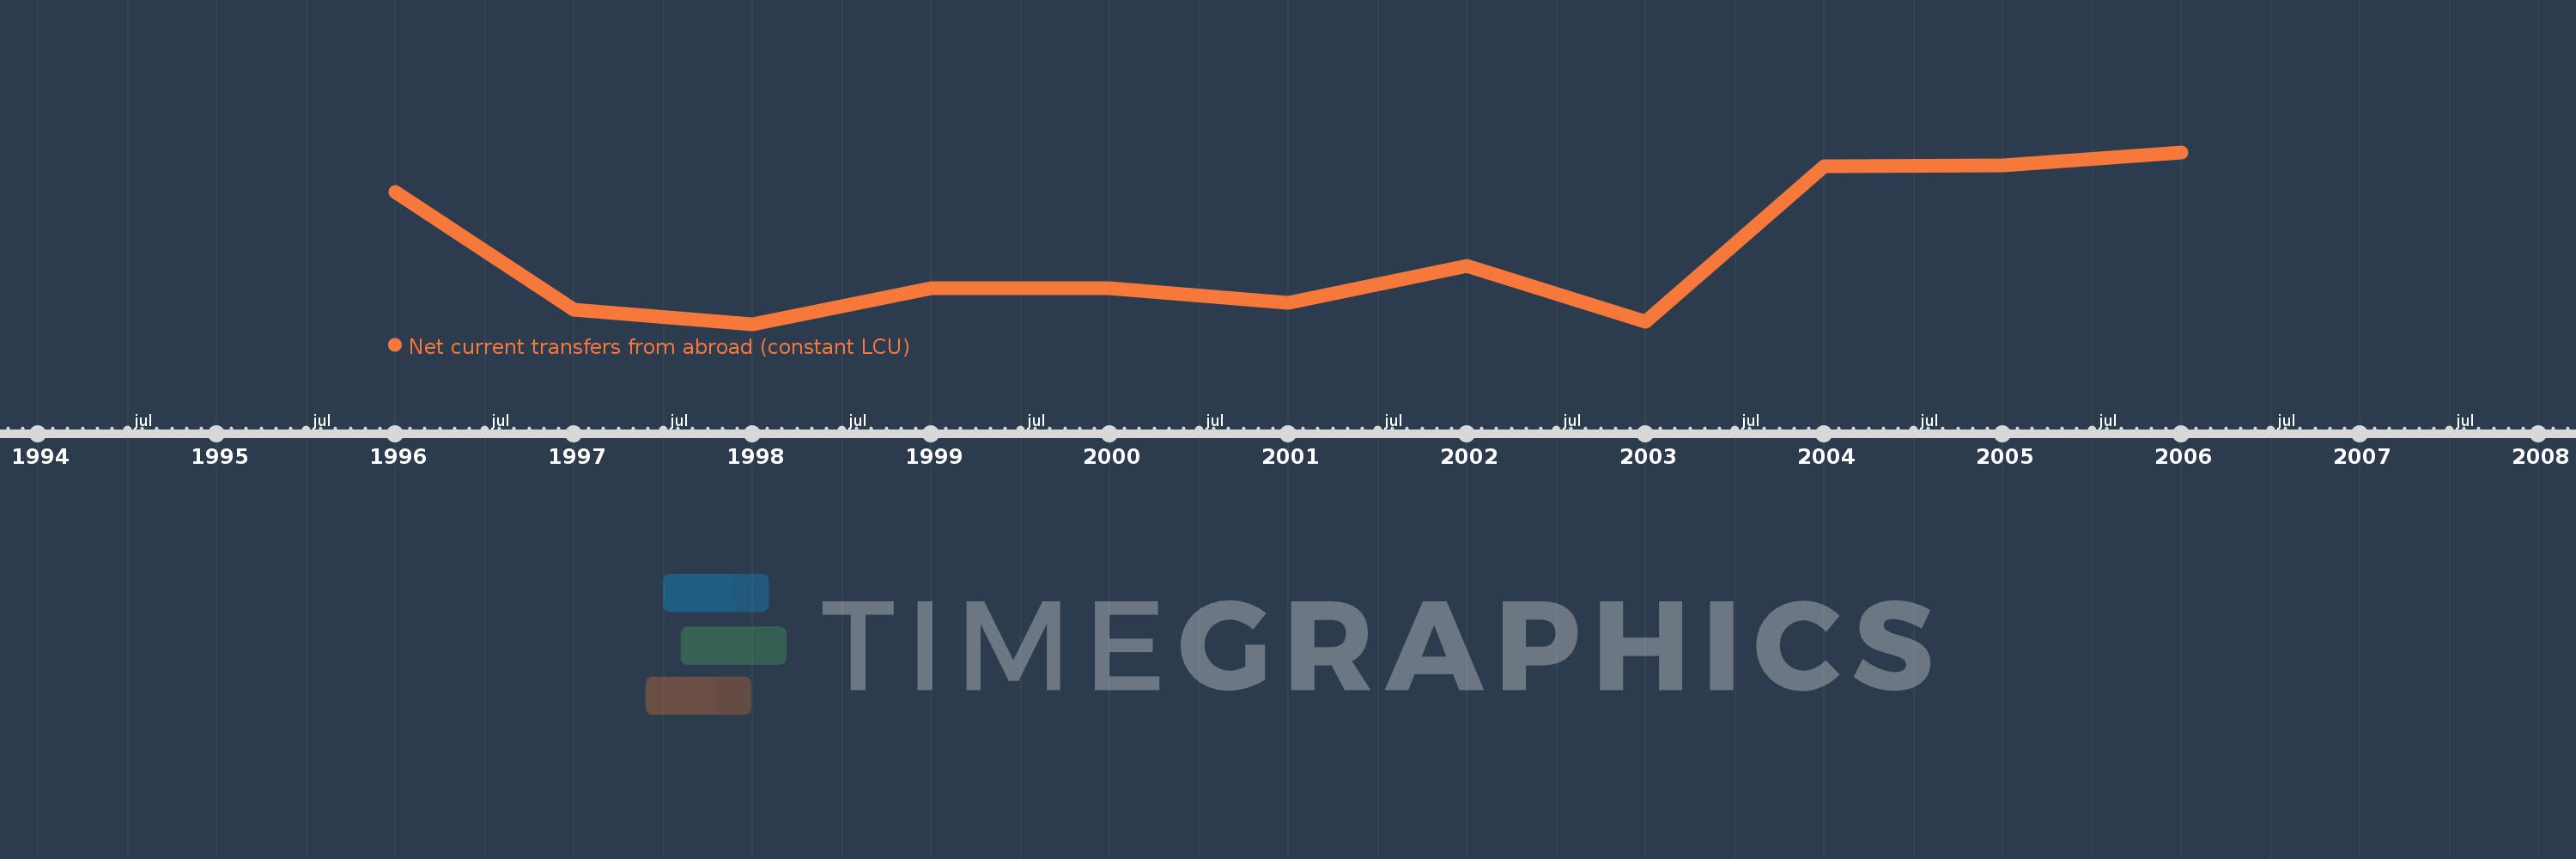
Net current transfers from abroad (constant LCU)
2006,2005,2004,2003,2002,2001,2000,1999,1998,1997,1996
This statistics in other country:
Timeline:
This timeline shows a graph from 1996 to 2006 of Paraguay. No data until 1995. Number of actual observations by date: 11.
Source name:
World Development Indicators
Source organization:
World Bank national accounts data, and OECD National Accounts data files.
Categories, topics:
Economy & Growth
Last updated:
apr 23, 2017
Indicators value changes by year
Minimum:
343.56 bln
jan 1, 1998
Maximum:
484.805 bln
jan 1, 2006
At the date of observation
Value
Absolute change
Change from previous value
jan 1, 1996
452.327 bln
+452.327 bln
0.0%
jan 1, 1997
355.155 bln
-97.172 bln
-21.48%
jan 1, 1998
343.56 bln
-11.595 bln
-3.26%
jan 1, 1999
373.294 bln
+29.734 bln
8.65%
jan 1, 2000
372.799 bln
-494.741 mln
-0.13%
jan 1, 2001
361.116 bln
-11.683 bln
-3.13%
jan 1, 2002
391.33 bln
+30.215 bln
8.37%
jan 1, 2003
345.903 bln
-45.427 bln
-11.61%
jan 1, 2004
473.595 bln
+127.692 bln
36.92%
jan 1, 2005
474.221 bln
+626.041 mln
0.13%
jan 1, 2006
484.805 bln
+10.584 bln
2.23%
Ranking of countries by current statistics by years


Comments: