29
/
en
AIzaSyAYiBZKx7MnpbEhh9jyipgxe19OcubqV5w
April 1, 2024
96462
Burundi
BDI
true
2
1
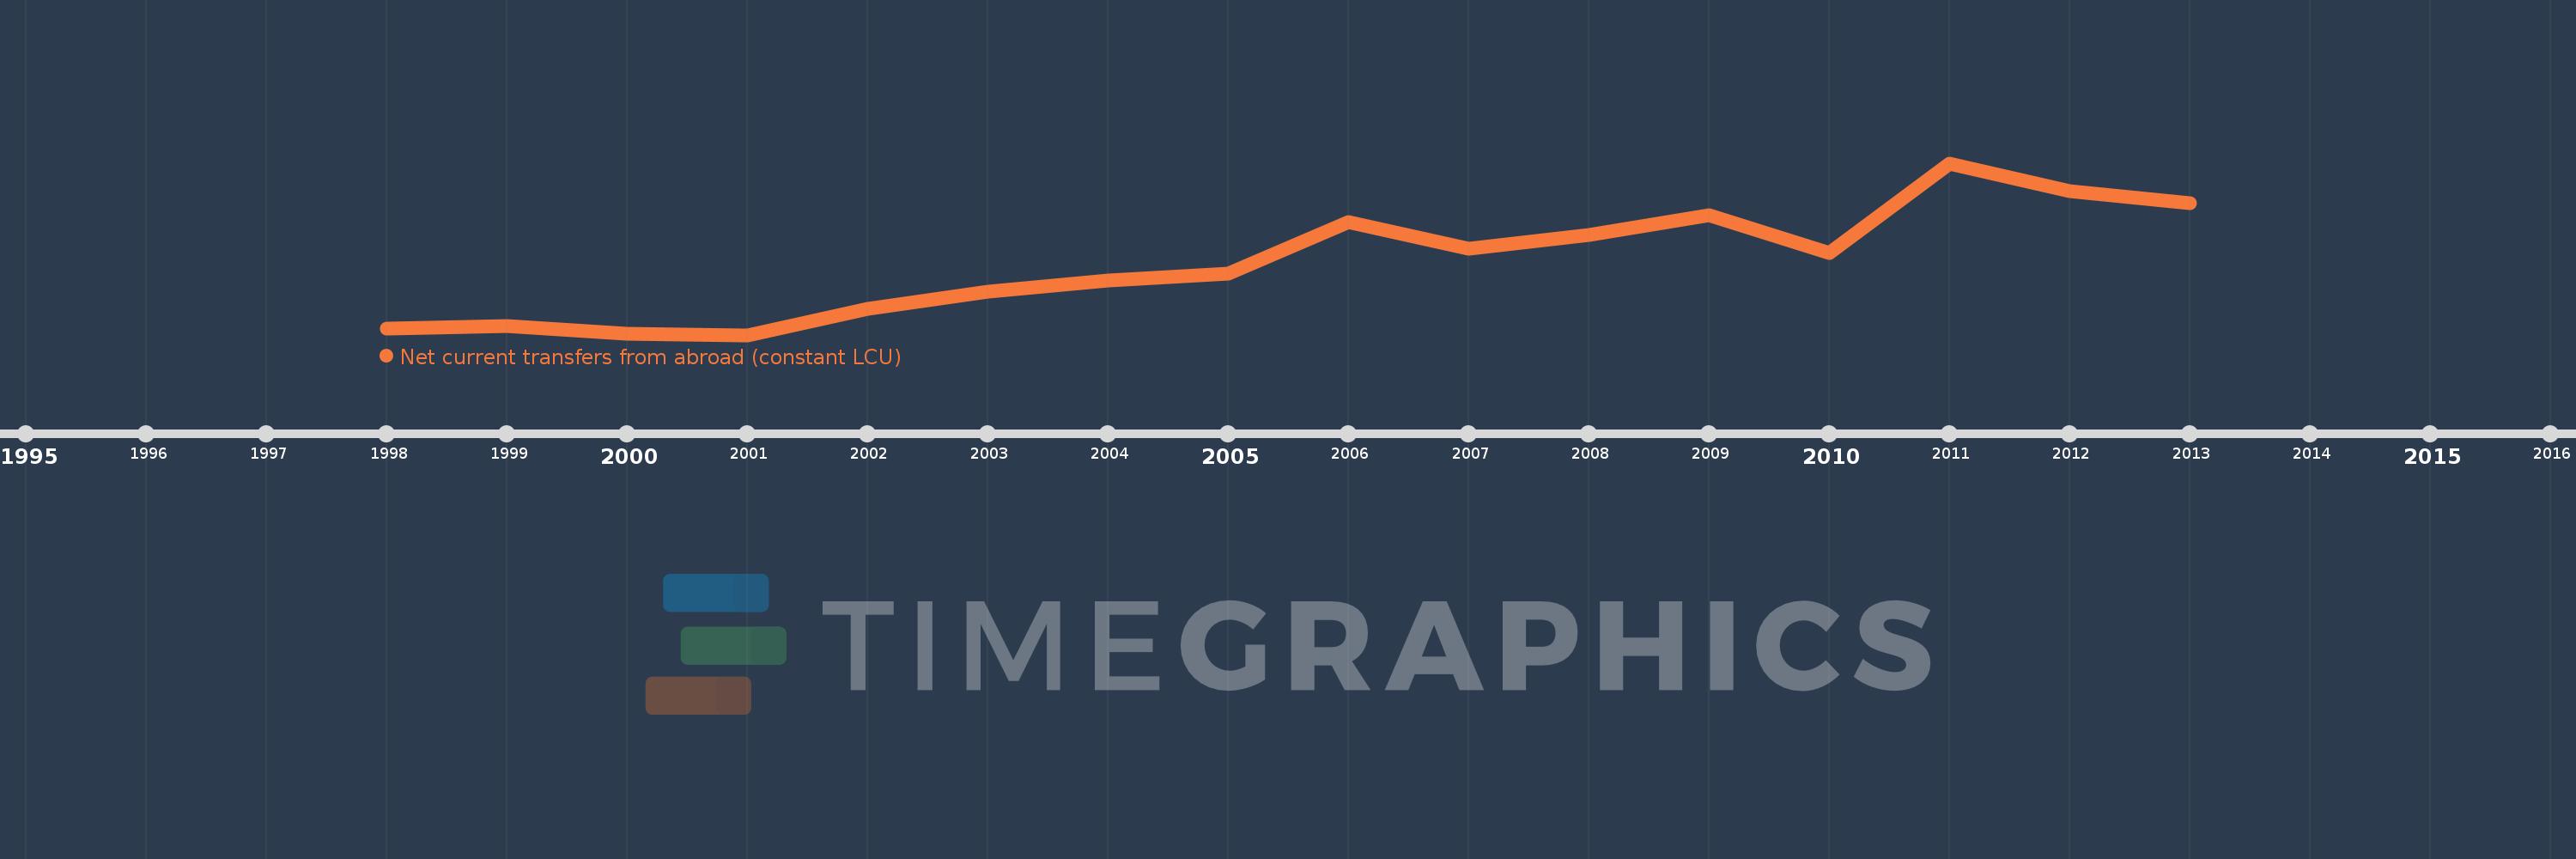
Net current transfers from abroad (constant LCU)
2013,2012,2011,2010,2009,2008,2007,2006,2005,2004,2003,2002,2001,2000,1999,1998
This statistics in other country:
Timeline:
This timeline shows a graph from 1998 to 2013 of Burundi. No data until 1997. Number of actual observations by date: 16.
Source name:
World Development Indicators
Source organization:
World Bank national accounts data, and OECD National Accounts data files.
Categories, topics:
Economy & Growth
Last updated:
apr 23, 2017
Indicators value changes by year
Minimum:
37.83 bln
jan 1, 2001
Maximum:
377.621 bln
jan 1, 2011
At the date of observation
Value
Absolute change
Change from previous value
jan 1, 1998
50.017 bln
+50.017 bln
0.0%
jan 1, 1999
55.399 bln
+5.382 bln
10.76%
jan 1, 2000
40.072 bln
-15.326 bln
-27.67%
jan 1, 2001
37.83 bln
-2.242 bln
-5.59%
jan 1, 2002
89.607 bln
+51.777 bln
136.87%
jan 1, 2003
124.142 bln
+34.535 bln
38.54%
jan 1, 2004
145.672 bln
+21.529 bln
17.34%
jan 1, 2005
159.313 bln
+13.641 bln
9.36%
jan 1, 2006
260.553 bln
+101.24 bln
63.55%
jan 1, 2007
208.966 bln
-51.586 bln
-19.8%
jan 1, 2008
235.379 bln
+26.413 bln
12.64%
jan 1, 2009
274.917 bln
+39.538 bln
16.8%
jan 1, 2010
199.545 bln
-75.372 bln
-27.42%
jan 1, 2011
377.621 bln
+178.076 bln
89.24%
jan 1, 2012
323.074 bln
-54.547 bln
-14.44%
jan 1, 2013
298.175 bln
-24.899 bln
-7.71%
Ranking of countries by current statistics by years


Comments: