29
/
en
AIzaSyAYiBZKx7MnpbEhh9jyipgxe19OcubqV5w
April 1, 2024
79750
Barbados
BRB
true
2
1
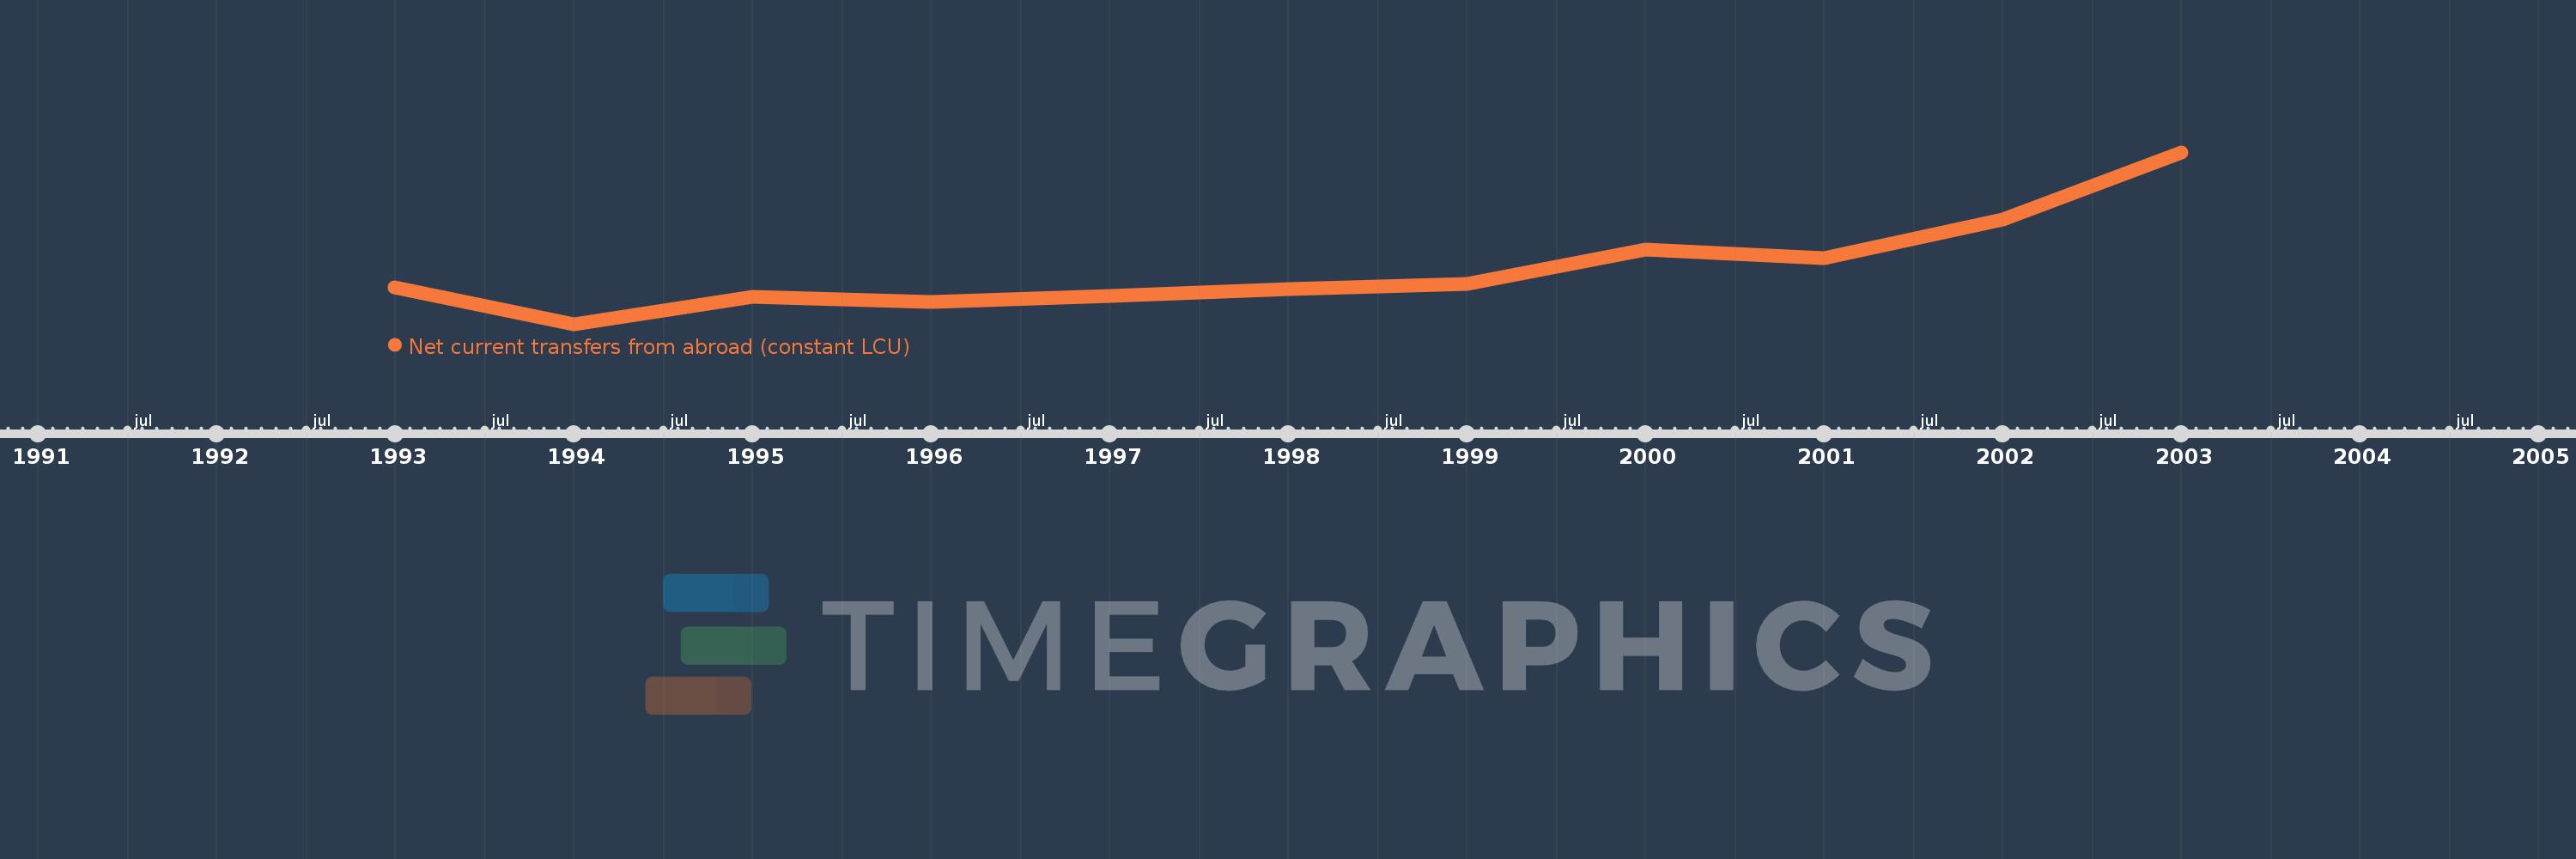
Net current transfers from abroad (constant LCU)
2003,2002,2001,2000,1999,1998,1997,1996,1995,1994,1993
This statistics in other country:
Timeline:
This timeline shows a graph from 1993 to 2003 of Barbados. No data until 1992. Number of actual observations by date: 11.
Source name:
World Development Indicators
Source organization:
World Bank national accounts data, and OECD National Accounts data files.
Categories, topics:
Economy & Growth
Last updated:
apr 23, 2017
Indicators value changes by year
Minimum:
9.039 mln
jan 1, 1994
Maximum:
77.781 mln
jan 1, 2003
At the date of observation
Value
Absolute change
Change from previous value
jan 1, 1993
23.87 mln
+23.87 mln
0.0%
jan 1, 1994
9.039 mln
-14.832 mln
-62.14%
jan 1, 1995
20.081 mln
+11.043 mln
122.17%
jan 1, 1996
17.966 mln
-2.115 mln
-10.53%
jan 1, 1997
20.38 mln
+2.414 mln
13.43%
jan 1, 1998
23.257 mln
+2.878 mln
14.12%
jan 1, 1999
25.114 mln
+1.857 mln
7.98%
jan 1, 2000
38.915 mln
+13.801 mln
54.95%
jan 1, 2001
35.392 mln
-3.523 mln
-9.05%
jan 1, 2002
50.906 mln
+15.514 mln
43.84%
jan 1, 2003
77.781 mln
+26.875 mln
52.79%
Ranking of countries by current statistics by years


Comments: