29
/
en
AIzaSyAYiBZKx7MnpbEhh9jyipgxe19OcubqV5w
April 1, 2024
247651
Spain
ESP
true
2
1
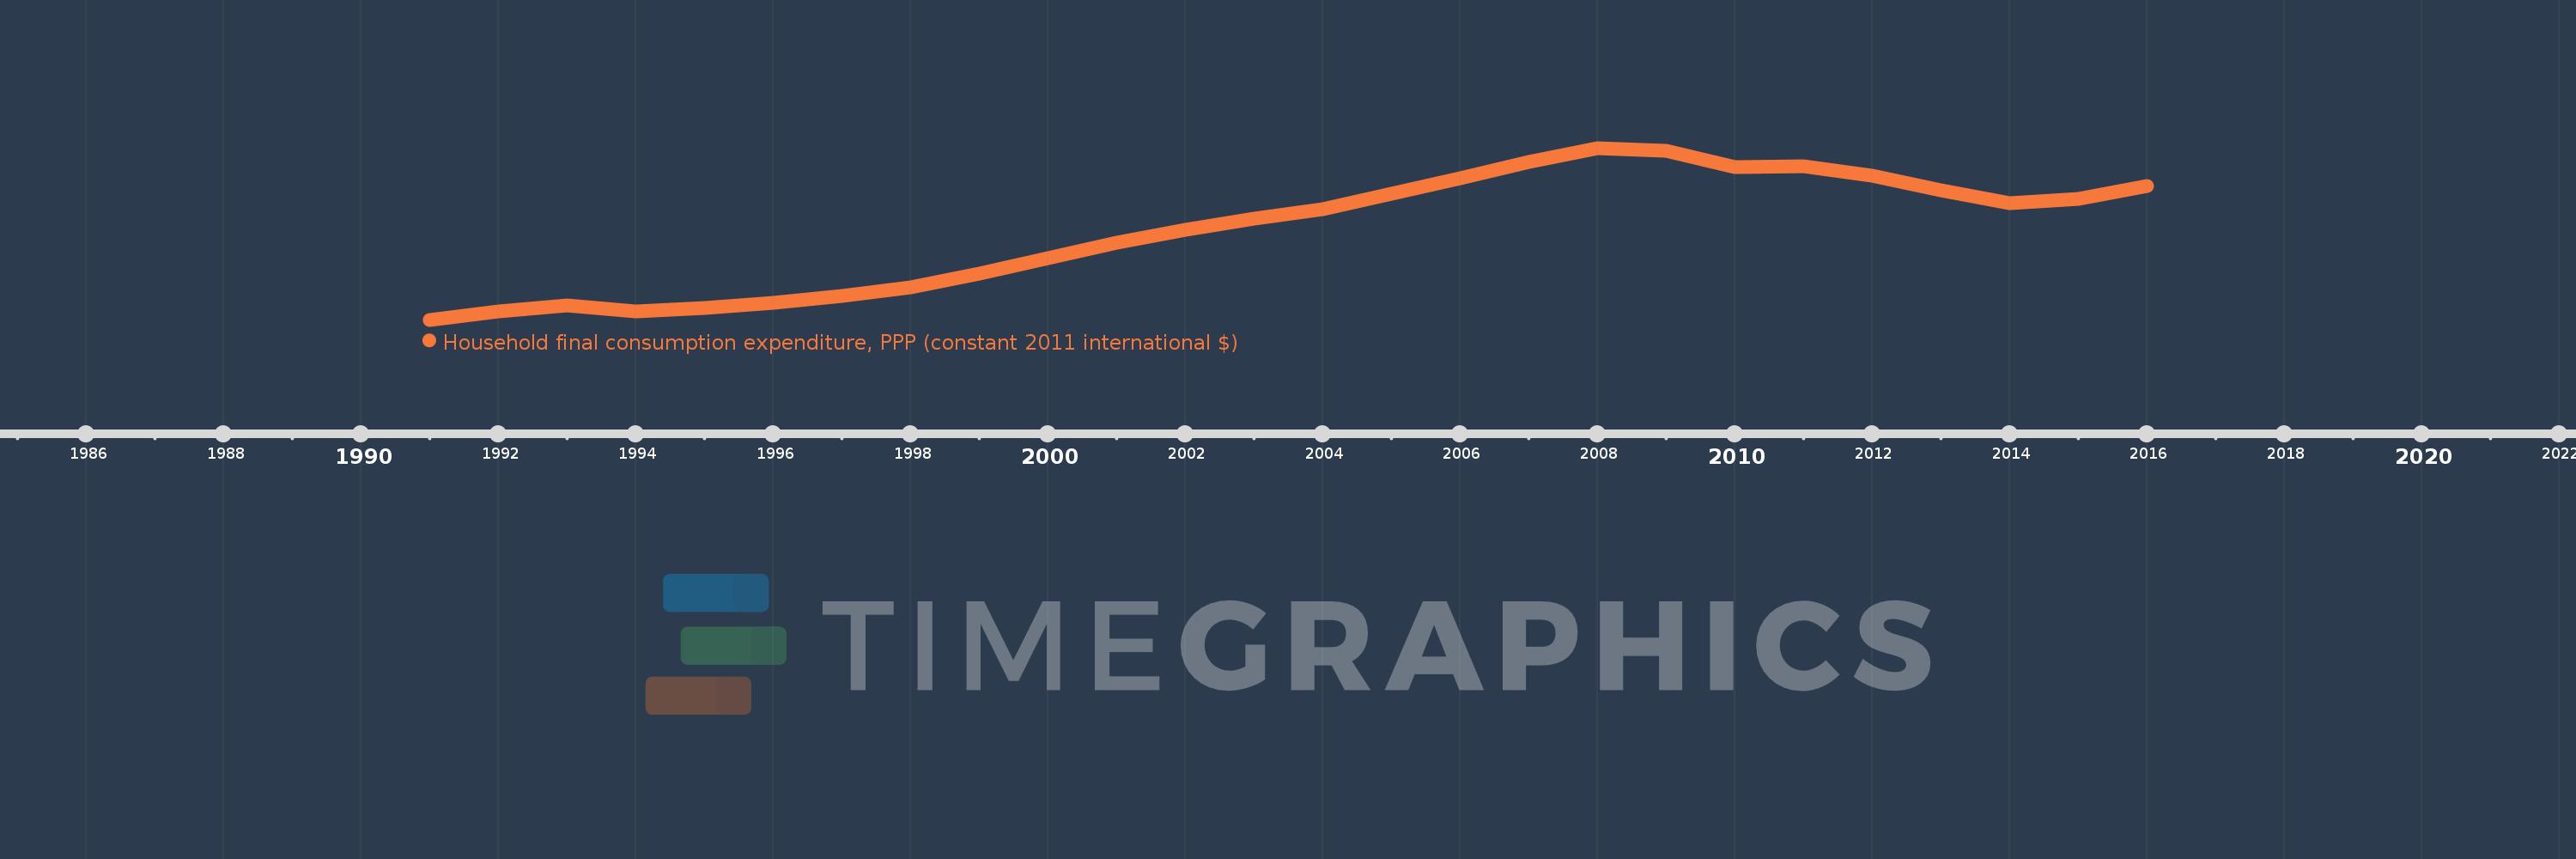
Household final consumption expenditure, PPP (constant 2011 international $)
2016,2015,2014,2013,2012,2011,2010,2009,2008,2007,2006,2005,2004,2003,2002,2001,2000,1999,1998,1997,1996,1995,1994,1993,1992,1991
This statistics in other country:
AfghanistanAlbaniaAlgeriaAngolaAntigua and BarbudaArab WorldArgentinaArmeniaArubaAustraliaAustriaAzerbaijanBahamas, TheBahrainBangladeshBarbadosBelarusBelgiumBelizeBeninBermudaBhutanBoliviaBosnia and HerzegovinaBotswanaBrazilBrunei DarussalamBulgariaBurkina FasoBurundiCabo VerdeCambodiaCameroonCanadaCaribbean small statesCentral African RepublicCentral Europe and the BalticsChadChileChinaColombiaComorosCongo, Dem. Rep.Congo, Rep.Costa RicaCote d'IvoireCroatiaCubaCyprusCzech RepublicDenmarkDominicaDominican RepublicEarly-demographic dividendEast Asia & PacificEast Asia & Pacific (excluding high income)East Asia & Pacific (IDA & IBRD countries)EcuadorEgypt, Arab Rep.El SalvadorEquatorial GuineaEritreaEstoniaEthiopiaEuro areaEurope & Central AsiaEurope & Central Asia (excluding high income)Europe & Central Asia (IDA & IBRD countries)European UnionFinlandFranceGabonGambia, TheGeorgiaGermanyGhanaGreeceGrenadaGuatemalaGuineaGuinea-BissauGuyanaHaitiHeavily indebted poor countries (HIPC)High incomeHondurasHong Kong SAR, ChinaHungaryIBRD onlyIcelandIDA & IBRD totalIDA blendIDA onlyIDA totalIndiaIndonesiaIran, Islamic Rep.IrelandIsraelItalyJamaicaJapanJordanKazakhstanKenyaKorea, Rep.KosovoKuwaitKyrgyz RepublicLao PDRLate-demographic dividendLatin America & Caribbean Latin America & Caribbean (excluding high income)Latin America & the Caribbean (IDA & IBRD countries)LatviaLebanonLiberiaLithuaniaLow & middle incomeLow incomeLower middle incomeLuxembourgMacao SAR, ChinaMacedonia, FYRMadagascarMalawiMalaysiaMaliMaltaMauritaniaMauritiusMexicoMiddle East & North AfricaMiddle East & North Africa (excluding high income)Middle East & North Africa (IDA & IBRD countries)Middle incomeMoldovaMongoliaMontenegroMoroccoMozambiqueNamibiaNepalNetherlandsNew ZealandNicaraguaNigerNigeriaNorth AmericaNorwayOECD membersOmanOther small statesPakistanPanamaParaguayPeruPhilippinesPolandPortugalPost-demographic dividendPre-demographic dividendPuerto RicoQatarRomaniaRussian FederationRwandaSaudi ArabiaSenegalSerbiaSeychellesSierra LeoneSingaporeSlovak RepublicSloveniaSmall statesSouth AfricaSouth AsiaSouth Asia (IDA & IBRD)South SudanSpainSri LankaSt. Kitts and NevisSt. LuciaSt. Vincent and the GrenadinesSub-Saharan Africa Sub-Saharan Africa (excluding high income)Sub-Saharan Africa (IDA & IBRD countries)SudanSurinameSwazilandSwedenSwitzerlandTajikistanTanzaniaThailandTimor-LesteTogoTongaTrinidad and TobagoTunisiaTurkeyTurkmenistanUgandaUkraineUnited Arab EmiratesUnited KingdomUnited StatesUpper middle incomeUruguayUzbekistanVanuatuVenezuela, RBVietnamWest Bank and GazaWorldYemen, Rep.ZambiaZimbabwe Timeline:
This timeline shows a graph from 1991 to 2016 of Spain. No data until 1990. Number of actual observations by date: 26.
Source name:
World Development Indicators
Source organization:
World Bank, International Comparison Program database.
Categories, topics:
Economy & Growth
Last updated:
apr 23, 2017
Indicators value changes by year
Minimum:
521.555 bln
jan 1, 1991
Maximum:
846.761 bln
jan 1, 2008
At the date of observation
Value
Absolute change
Change from previous value
jan 1, 1991
521.555 bln
+521.555 bln
0.0%
jan 1, 1992
536.611 bln
+15.056 bln
2.89%
jan 1, 1993
548.274 bln
+11.663 bln
2.17%
jan 1, 1994
537.843 bln
-10.432 bln
-1.9%
jan 1, 1995
543.675 bln
+5.833 bln
1.08%
jan 1, 1996
552.992 bln
+9.316 bln
1.71%
jan 1, 1997
566.582 bln
+13.59 bln
2.46%
jan 1, 1998
582.787 bln
+16.206 bln
2.86%
jan 1, 1999
608.692 bln
+25.905 bln
4.44%
jan 1, 2000
638.432 bln
+29.741 bln
4.89%
jan 1, 2001
667.544 bln
+29.111 bln
4.56%
jan 1, 2002
692.416 bln
+24.872 bln
3.73%
jan 1, 2003
713.181 bln
+20.765 bln
3.0%
jan 1, 2004
730.175 bln
+16.994 bln
2.38%
jan 1, 2005
759.612 bln
+29.437 bln
4.03%
jan 1, 2006
789.998 bln
+30.386 bln
4.0%
jan 1, 2007
820.0 bln
+30.002 bln
3.8%
jan 1, 2008
846.761 bln
+26.761 bln
3.26%
jan 1, 2009
841.228 bln
-5.533 bln
-0.65%
jan 1, 2010
810.814 bln
-30.413 bln
-3.62%
jan 1, 2011
812.851 bln
+2.036 bln
0.25%
jan 1, 2012
793.717 bln
-19.134 bln
-2.35%
jan 1, 2013
765.851 bln
-27.866 bln
-3.51%
jan 1, 2014
742.395 bln
-23.456 bln
-3.06%
jan 1, 2015
750.96 bln
+8.565 bln
1.15%
jan 1, 2016
774.247 bln
+23.286 bln
3.1%
Ranking of countries by current statistics by years


Comments: