29
/
en
AIzaSyAYiBZKx7MnpbEhh9jyipgxe19OcubqV5w
April 1, 2024
256441
Sweden
SWE
true
2
1
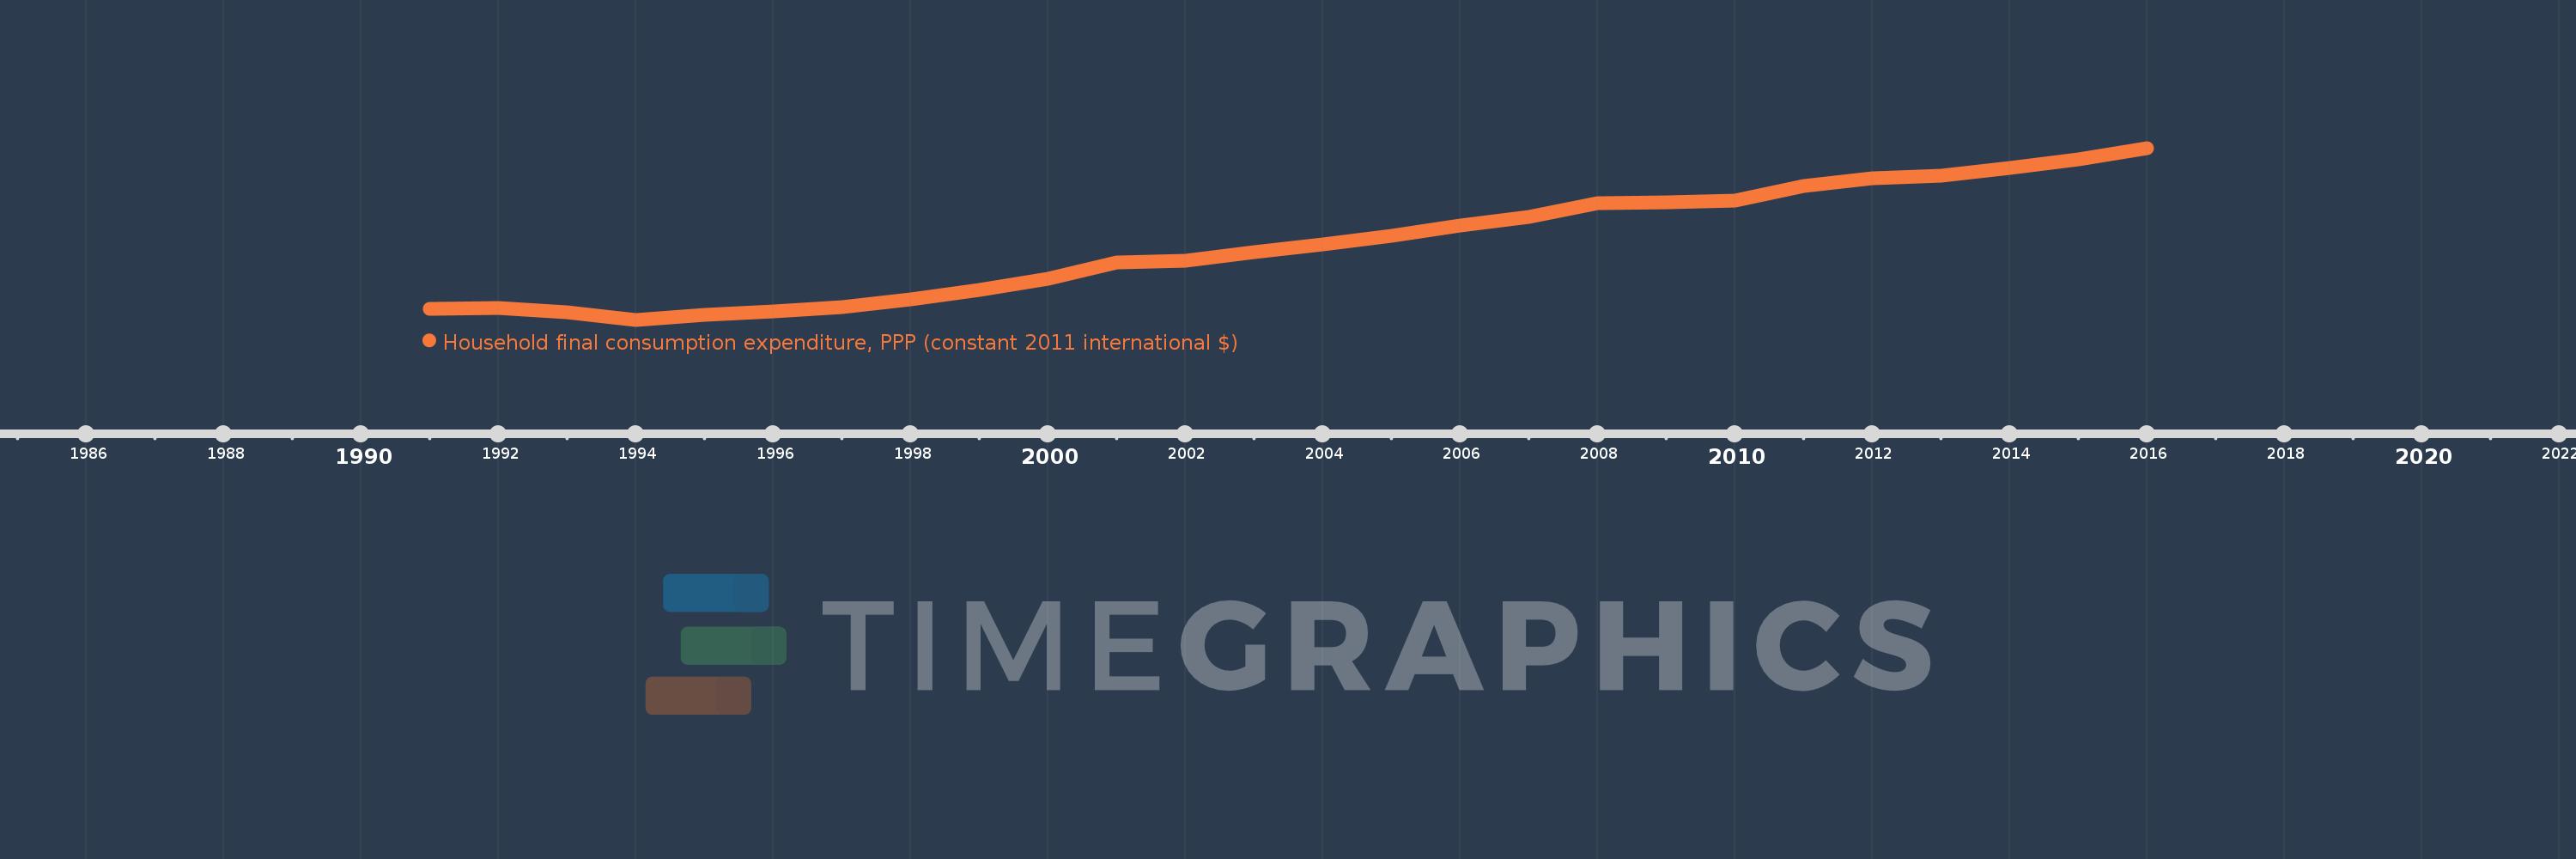
Household final consumption expenditure, PPP (constant 2011 international $)
2016,2015,2014,2013,2012,2011,2010,2009,2008,2007,2006,2005,2004,2003,2002,2001,2000,1999,1998,1997,1996,1995,1994,1993,1992,1991
This statistics in other country:
AfghanistanAlbaniaAlgeriaAngolaAntigua and BarbudaArab WorldArgentinaArmeniaArubaAustraliaAustriaAzerbaijanBahamas, TheBahrainBangladeshBarbadosBelarusBelgiumBelizeBeninBermudaBhutanBoliviaBosnia and HerzegovinaBotswanaBrazilBrunei DarussalamBulgariaBurkina FasoBurundiCabo VerdeCambodiaCameroonCanadaCaribbean small statesCentral African RepublicCentral Europe and the BalticsChadChileChinaColombiaComorosCongo, Dem. Rep.Congo, Rep.Costa RicaCote d'IvoireCroatiaCubaCyprusCzech RepublicDenmarkDominicaDominican RepublicEarly-demographic dividendEast Asia & PacificEast Asia & Pacific (excluding high income)East Asia & Pacific (IDA & IBRD countries)EcuadorEgypt, Arab Rep.El SalvadorEquatorial GuineaEritreaEstoniaEthiopiaEuro areaEurope & Central AsiaEurope & Central Asia (excluding high income)Europe & Central Asia (IDA & IBRD countries)European UnionFinlandFranceGabonGambia, TheGeorgiaGermanyGhanaGreeceGrenadaGuatemalaGuineaGuinea-BissauGuyanaHaitiHeavily indebted poor countries (HIPC)High incomeHondurasHong Kong SAR, ChinaHungaryIBRD onlyIcelandIDA & IBRD totalIDA blendIDA onlyIDA totalIndiaIndonesiaIran, Islamic Rep.IrelandIsraelItalyJamaicaJapanJordanKazakhstanKenyaKorea, Rep.KosovoKuwaitKyrgyz RepublicLao PDRLate-demographic dividendLatin America & Caribbean Latin America & Caribbean (excluding high income)Latin America & the Caribbean (IDA & IBRD countries)LatviaLebanonLiberiaLithuaniaLow & middle incomeLow incomeLower middle incomeLuxembourgMacao SAR, ChinaMacedonia, FYRMadagascarMalawiMalaysiaMaliMaltaMauritaniaMauritiusMexicoMiddle East & North AfricaMiddle East & North Africa (excluding high income)Middle East & North Africa (IDA & IBRD countries)Middle incomeMoldovaMongoliaMontenegroMoroccoMozambiqueNamibiaNepalNetherlandsNew ZealandNicaraguaNigerNigeriaNorth AmericaNorwayOECD membersOmanOther small statesPakistanPanamaParaguayPeruPhilippinesPolandPortugalPost-demographic dividendPre-demographic dividendPuerto RicoQatarRomaniaRussian FederationRwandaSaudi ArabiaSenegalSerbiaSeychellesSierra LeoneSingaporeSlovak RepublicSloveniaSmall statesSouth AfricaSouth AsiaSouth Asia (IDA & IBRD)South SudanSpainSri LankaSt. Kitts and NevisSt. LuciaSt. Vincent and the GrenadinesSub-Saharan Africa Sub-Saharan Africa (excluding high income)Sub-Saharan Africa (IDA & IBRD countries)SudanSurinameSwazilandSwedenSwitzerlandTajikistanTanzaniaThailandTimor-LesteTogoTongaTrinidad and TobagoTunisiaTurkeyTurkmenistanUgandaUkraineUnited Arab EmiratesUnited KingdomUnited StatesUpper middle incomeUruguayUzbekistanVanuatuVenezuela, RBVietnamWest Bank and GazaWorldYemen, Rep.ZambiaZimbabwe Timeline:
This timeline shows a graph from 1991 to 2016 of Sweden. No data until 1990. Number of actual observations by date: 26.
Source name:
World Development Indicators
Source organization:
World Bank, International Comparison Program database.
Categories, topics:
Economy & Growth
Last updated:
apr 23, 2017
Indicators value changes by year
Minimum:
121.264 bln
jan 1, 1994
Maximum:
201.991 bln
jan 1, 2016
At the date of observation
Value
Absolute change
Change from previous value
jan 1, 1991
126.549 bln
+126.549 bln
0.0%
jan 1, 1992
126.833 bln
+283.924 mln
0.22%
jan 1, 1993
124.878 bln
-1.955 bln
-1.54%
jan 1, 1994
121.264 bln
-3.614 bln
-2.89%
jan 1, 1995
123.701 bln
+2.437 bln
2.01%
jan 1, 1996
125.024 bln
+1.323 bln
1.07%
jan 1, 1997
127.291 bln
+2.266 bln
1.81%
jan 1, 1998
130.87 bln
+3.579 bln
2.81%
jan 1, 1999
135.19 bln
+4.32 bln
3.3%
jan 1, 2000
140.638 bln
+5.447 bln
4.03%
jan 1, 2001
148.019 bln
+7.381 bln
5.25%
jan 1, 2002
149.101 bln
+1.082 bln
0.73%
jan 1, 2003
152.988 bln
+3.887 bln
2.61%
jan 1, 2004
156.529 bln
+3.541 bln
2.31%
jan 1, 2005
160.895 bln
+4.366 bln
2.79%
jan 1, 2006
165.348 bln
+4.453 bln
2.77%
jan 1, 2007
169.765 bln
+4.417 bln
2.67%
jan 1, 2008
176.207 bln
+6.442 bln
3.79%
jan 1, 2009
176.609 bln
+401.443 mln
0.23%
jan 1, 2010
177.228 bln
+619.624 mln
0.35%
jan 1, 2011
184.123 bln
+6.895 bln
3.89%
jan 1, 2012
187.56 bln
+3.437 bln
1.87%
jan 1, 2013
189.041 bln
+1.481 bln
0.79%
jan 1, 2014
192.555 bln
+3.514 bln
1.86%
jan 1, 2015
196.652 bln
+4.097 bln
2.13%
jan 1, 2016
201.991 bln
+5.339 bln
2.72%
Ranking of countries by current statistics by years


Comments: