29
/
en
AIzaSyAYiBZKx7MnpbEhh9jyipgxe19OcubqV5w
April 1, 2024
118006
Czech Republic
CZE
true
2
1
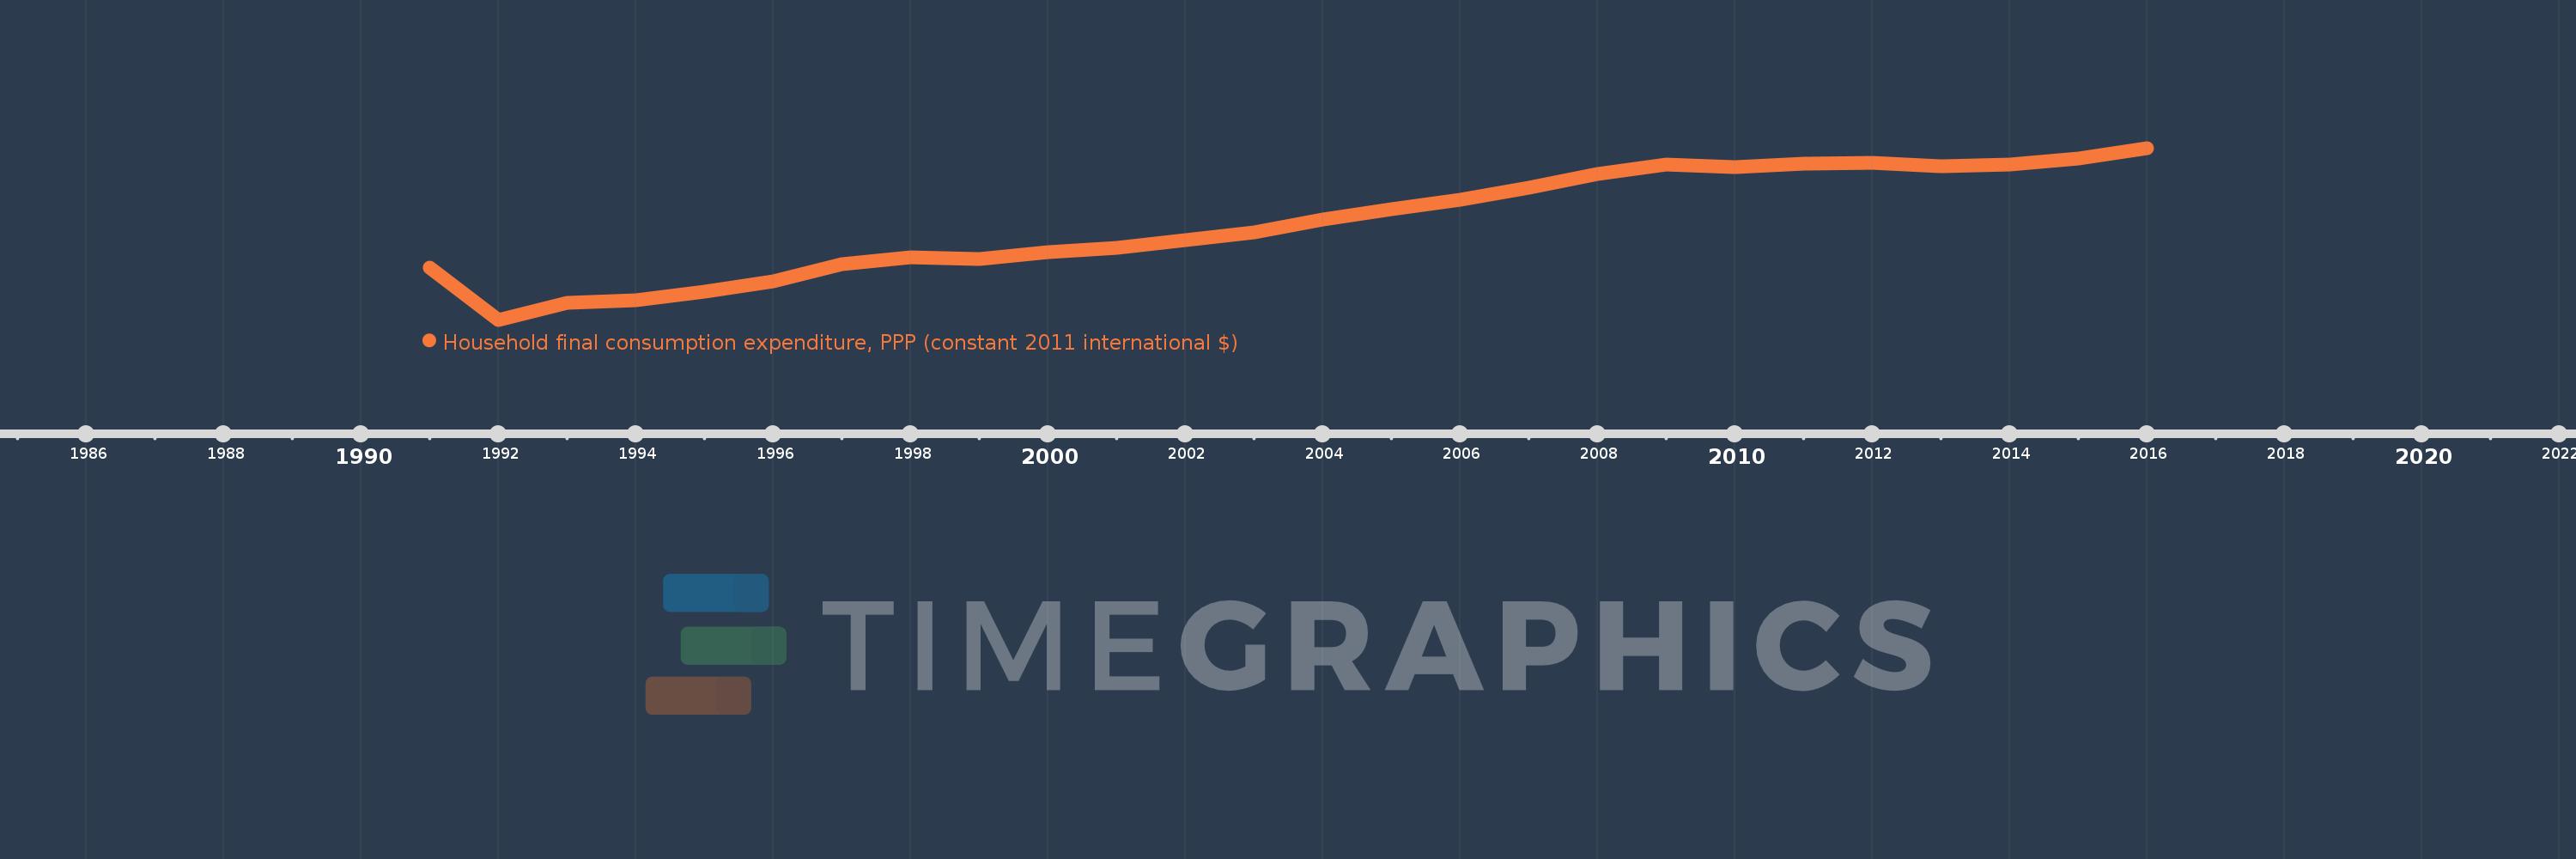
Household final consumption expenditure, PPP (constant 2011 international $)
2016,2015,2014,2013,2012,2011,2010,2009,2008,2007,2006,2005,2004,2003,2002,2001,2000,1999,1998,1997,1996,1995,1994,1993,1992,1991
This statistics in other country:
AfghanistanAlbaniaAlgeriaAngolaAntigua and BarbudaArab WorldArgentinaArmeniaArubaAustraliaAustriaAzerbaijanBahamas, TheBahrainBangladeshBarbadosBelarusBelgiumBelizeBeninBermudaBhutanBoliviaBosnia and HerzegovinaBotswanaBrazilBrunei DarussalamBulgariaBurkina FasoBurundiCabo VerdeCambodiaCameroonCanadaCaribbean small statesCentral African RepublicCentral Europe and the BalticsChadChileChinaColombiaComorosCongo, Dem. Rep.Congo, Rep.Costa RicaCote d'IvoireCroatiaCubaCyprusCzech RepublicDenmarkDominicaDominican RepublicEarly-demographic dividendEast Asia & PacificEast Asia & Pacific (excluding high income)East Asia & Pacific (IDA & IBRD countries)EcuadorEgypt, Arab Rep.El SalvadorEquatorial GuineaEritreaEstoniaEthiopiaEuro areaEurope & Central AsiaEurope & Central Asia (excluding high income)Europe & Central Asia (IDA & IBRD countries)European UnionFinlandFranceGabonGambia, TheGeorgiaGermanyGhanaGreeceGrenadaGuatemalaGuineaGuinea-BissauGuyanaHaitiHeavily indebted poor countries (HIPC)High incomeHondurasHong Kong SAR, ChinaHungaryIBRD onlyIcelandIDA & IBRD totalIDA blendIDA onlyIDA totalIndiaIndonesiaIran, Islamic Rep.IrelandIsraelItalyJamaicaJapanJordanKazakhstanKenyaKorea, Rep.KosovoKuwaitKyrgyz RepublicLao PDRLate-demographic dividendLatin America & Caribbean Latin America & Caribbean (excluding high income)Latin America & the Caribbean (IDA & IBRD countries)LatviaLebanonLiberiaLithuaniaLow & middle incomeLow incomeLower middle incomeLuxembourgMacao SAR, ChinaMacedonia, FYRMadagascarMalawiMalaysiaMaliMaltaMauritaniaMauritiusMexicoMiddle East & North AfricaMiddle East & North Africa (excluding high income)Middle East & North Africa (IDA & IBRD countries)Middle incomeMoldovaMongoliaMontenegroMoroccoMozambiqueNamibiaNepalNetherlandsNew ZealandNicaraguaNigerNigeriaNorth AmericaNorwayOECD membersOmanOther small statesPakistanPanamaParaguayPeruPhilippinesPolandPortugalPost-demographic dividendPre-demographic dividendPuerto RicoQatarRomaniaRussian FederationRwandaSaudi ArabiaSenegalSerbiaSeychellesSierra LeoneSingaporeSlovak RepublicSloveniaSmall statesSouth AfricaSouth AsiaSouth Asia (IDA & IBRD)South SudanSpainSri LankaSt. Kitts and NevisSt. LuciaSt. Vincent and the GrenadinesSub-Saharan Africa Sub-Saharan Africa (excluding high income)Sub-Saharan Africa (IDA & IBRD countries)SudanSurinameSwazilandSwedenSwitzerlandTajikistanTanzaniaThailandTimor-LesteTogoTongaTrinidad and TobagoTunisiaTurkeyTurkmenistanUgandaUkraineUnited Arab EmiratesUnited KingdomUnited StatesUpper middle incomeUruguayUzbekistanVanuatuVenezuela, RBVietnamWest Bank and GazaWorldYemen, Rep.ZambiaZimbabwe Timeline:
This timeline shows a graph from 1991 to 2016 of Czech Republic. No data until 1990. Number of actual observations by date: 26.
Source name:
World Development Indicators
Source organization:
World Bank, International Comparison Program database.
Categories, topics:
Economy & Growth
Last updated:
apr 23, 2017
Indicators value changes by year
Minimum:
74.285 bln
jan 1, 1992
Maximum:
141.405 bln
jan 1, 2016
At the date of observation
Value
Absolute change
Change from previous value
jan 1, 1991
94.544 bln
+94.544 bln
0.0%
jan 1, 1992
74.285 bln
-20.259 bln
-21.43%
jan 1, 1993
80.831 bln
+6.545 bln
8.81%
jan 1, 1994
81.836 bln
+1.005 bln
1.24%
jan 1, 1995
85.259 bln
+3.422 bln
4.18%
jan 1, 1996
89.219 bln
+3.96 bln
4.64%
jan 1, 1997
95.856 bln
+6.638 bln
7.44%
jan 1, 1998
98.591 bln
+2.735 bln
2.85%
jan 1, 1999
97.954 bln
-637.164 mln
-0.65%
jan 1, 2000
100.824 bln
+2.87 bln
2.93%
jan 1, 2001
102.439 bln
+1.615 bln
1.6%
jan 1, 2002
105.323 bln
+2.884 bln
2.82%
jan 1, 2003
108.402 bln
+3.079 bln
2.92%
jan 1, 2004
113.559 bln
+5.157 bln
4.76%
jan 1, 2005
117.503 bln
+3.944 bln
3.47%
jan 1, 2006
121.32 bln
+3.817 bln
3.25%
jan 1, 2007
125.911 bln
+4.591 bln
3.78%
jan 1, 2008
131.124 bln
+5.213 bln
4.14%
jan 1, 2009
134.927 bln
+3.804 bln
2.9%
jan 1, 2010
134.043 bln
-884.158 mln
-0.66%
jan 1, 2011
135.393 bln
+1.35 bln
1.01%
jan 1, 2012
135.757 bln
+363.677 mln
0.27%
jan 1, 2013
134.111 bln
-1.646 bln
-1.21%
jan 1, 2014
134.8 bln
+689.525 mln
0.51%
jan 1, 2015
137.224 bln
+2.423 bln
1.8%
jan 1, 2016
141.405 bln
+4.181 bln
3.05%
Ranking of countries by current statistics by years


Comments: