29
/
en
AIzaSyAYiBZKx7MnpbEhh9jyipgxe19OcubqV5w
April 1, 2024
25772
Central Europe and the Baltics
CEB
false
2
1
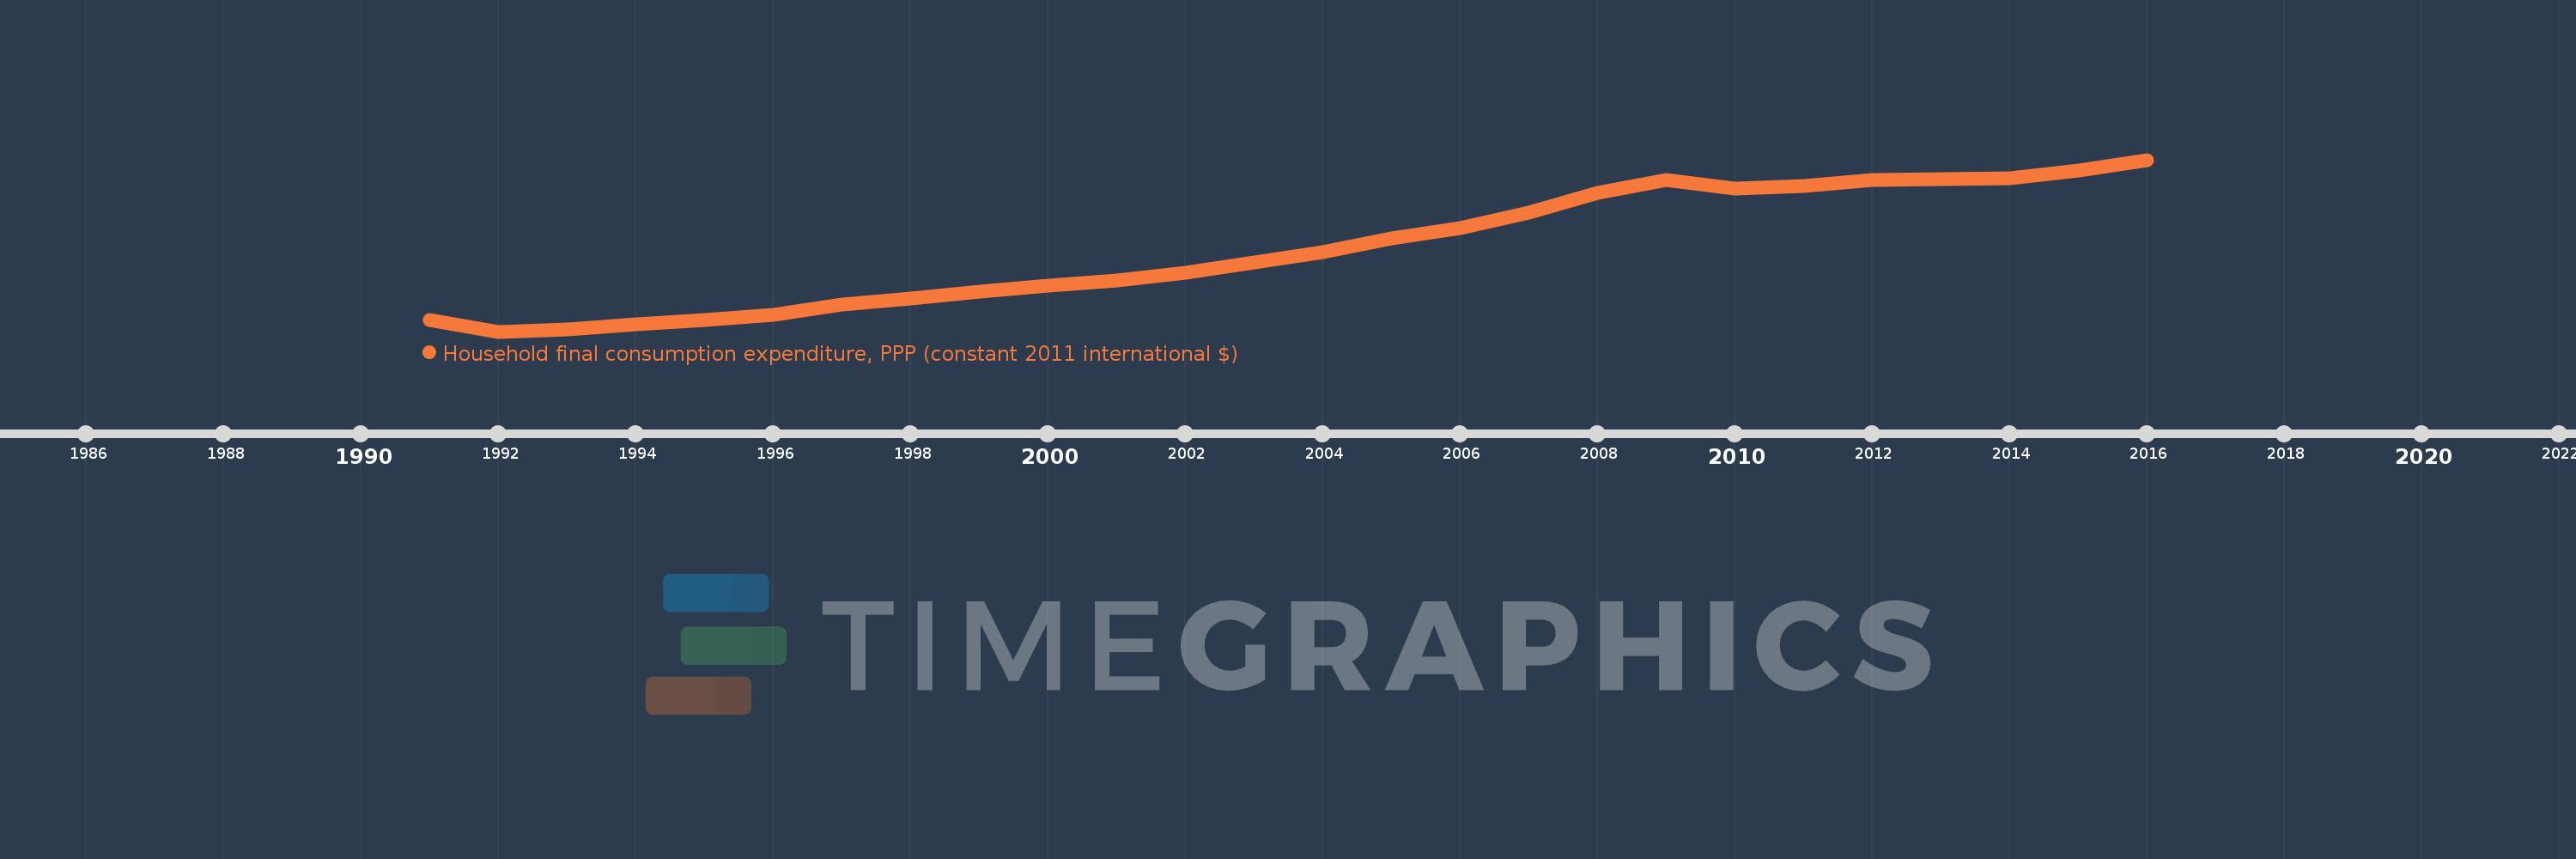
Household final consumption expenditure, PPP (constant 2011 international $)
2016,2015,2014,2013,2012,2011,2010,2009,2008,2007,2006,2005,2004,2003,2002,2001,2000,1999,1998,1997,1996,1995,1994,1993,1992,1991
This statistics in other country:
AfghanistanAlbaniaAlgeriaAngolaAntigua and BarbudaArab WorldArgentinaArmeniaArubaAustraliaAustriaAzerbaijanBahamas, TheBahrainBangladeshBarbadosBelarusBelgiumBelizeBeninBermudaBhutanBoliviaBosnia and HerzegovinaBotswanaBrazilBrunei DarussalamBulgariaBurkina FasoBurundiCabo VerdeCambodiaCameroonCanadaCaribbean small statesCentral African RepublicCentral Europe and the BalticsChadChileChinaColombiaComorosCongo, Dem. Rep.Congo, Rep.Costa RicaCote d'IvoireCroatiaCubaCyprusCzech RepublicDenmarkDominicaDominican RepublicEarly-demographic dividendEast Asia & PacificEast Asia & Pacific (excluding high income)East Asia & Pacific (IDA & IBRD countries)EcuadorEgypt, Arab Rep.El SalvadorEquatorial GuineaEritreaEstoniaEthiopiaEuro areaEurope & Central AsiaEurope & Central Asia (excluding high income)Europe & Central Asia (IDA & IBRD countries)European UnionFinlandFranceGabonGambia, TheGeorgiaGermanyGhanaGreeceGrenadaGuatemalaGuineaGuinea-BissauGuyanaHaitiHeavily indebted poor countries (HIPC)High incomeHondurasHong Kong SAR, ChinaHungaryIBRD onlyIcelandIDA & IBRD totalIDA blendIDA onlyIDA totalIndiaIndonesiaIran, Islamic Rep.IrelandIsraelItalyJamaicaJapanJordanKazakhstanKenyaKorea, Rep.KosovoKuwaitKyrgyz RepublicLao PDRLate-demographic dividendLatin America & Caribbean Latin America & Caribbean (excluding high income)Latin America & the Caribbean (IDA & IBRD countries)LatviaLebanonLiberiaLithuaniaLow & middle incomeLow incomeLower middle incomeLuxembourgMacao SAR, ChinaMacedonia, FYRMadagascarMalawiMalaysiaMaliMaltaMauritaniaMauritiusMexicoMiddle East & North AfricaMiddle East & North Africa (excluding high income)Middle East & North Africa (IDA & IBRD countries)Middle incomeMoldovaMongoliaMontenegroMoroccoMozambiqueNamibiaNepalNetherlandsNew ZealandNicaraguaNigerNigeriaNorth AmericaNorwayOECD membersOmanOther small statesPakistanPanamaParaguayPeruPhilippinesPolandPortugalPost-demographic dividendPre-demographic dividendPuerto RicoQatarRomaniaRussian FederationRwandaSaudi ArabiaSenegalSerbiaSeychellesSierra LeoneSingaporeSlovak RepublicSloveniaSmall statesSouth AfricaSouth AsiaSouth Asia (IDA & IBRD)South SudanSpainSri LankaSt. Kitts and NevisSt. LuciaSt. Vincent and the GrenadinesSub-Saharan Africa Sub-Saharan Africa (excluding high income)Sub-Saharan Africa (IDA & IBRD countries)SudanSurinameSwazilandSwedenSwitzerlandTajikistanTanzaniaThailandTimor-LesteTogoTongaTrinidad and TobagoTunisiaTurkeyTurkmenistanUgandaUkraineUnited Arab EmiratesUnited KingdomUnited StatesUpper middle incomeUruguayUzbekistanVanuatuVenezuela, RBVietnamWest Bank and GazaWorldYemen, Rep.ZambiaZimbabwe Timeline:
This timeline shows a graph from 1991 to 2016 of Central Europe and the Baltics. No data until 1990. Number of actual observations by date: 26.
Source name:
World Development Indicators
Source organization:
World Bank, International Comparison Program database.
Categories, topics:
Economy & Growth
Last updated:
apr 23, 2017
Indicators value changes by year
Minimum:
606.066 bln
jan 1, 1992
Maximum:
1.303 trl
jan 1, 2016
At the date of observation
Value
Absolute change
Change from previous value
jan 1, 1991
652.762 bln
+652.762 bln
0.0%
jan 1, 1992
606.066 bln
-46.696 bln
-7.15%
jan 1, 1993
614.381 bln
+8.315 bln
1.37%
jan 1, 1994
636.304 bln
+21.924 bln
3.57%
jan 1, 1995
654.787 bln
+18.483 bln
2.9%
jan 1, 1996
673.112 bln
+18.325 bln
2.8%
jan 1, 1997
715.114 bln
+42.002 bln
6.24%
jan 1, 1998
738.618 bln
+23.504 bln
3.29%
jan 1, 1999
767.08 bln
+28.462 bln
3.85%
jan 1, 2000
791.474 bln
+24.394 bln
3.18%
jan 1, 2001
813.684 bln
+22.21 bln
2.81%
jan 1, 2002
845.488 bln
+31.804 bln
3.91%
jan 1, 2003
887.489 bln
+42.001 bln
4.97%
jan 1, 2004
927.613 bln
+40.124 bln
4.52%
jan 1, 2005
983.097 bln
+55.484 bln
5.98%
jan 1, 2006
1.027 trl
+43.534 bln
4.43%
jan 1, 2007
1.09 trl
+63.008 bln
6.14%
jan 1, 2008
1.168 trl
+78.653 bln
7.22%
jan 1, 2009
1.22 trl
+51.571 bln
4.41%
jan 1, 2010
1.185 trl
-34.529 bln
-2.83%
jan 1, 2011
1.198 trl
+13.097 bln
1.1%
jan 1, 2012
1.22 trl
+21.692 bln
1.81%
jan 1, 2013
1.224 trl
+4.286 bln
0.35%
jan 1, 2014
1.228 trl
+3.248 bln
0.27%
jan 1, 2015
1.259 trl
+31.801 bln
2.59%
jan 1, 2016
1.303 trl
+43.654 bln
3.47%
Ranking of countries by current statistics by years


Comments: