29
/
en
AIzaSyAYiBZKx7MnpbEhh9jyipgxe19OcubqV5w
April 1, 2024
101191
Canada
CAN
true
2
1
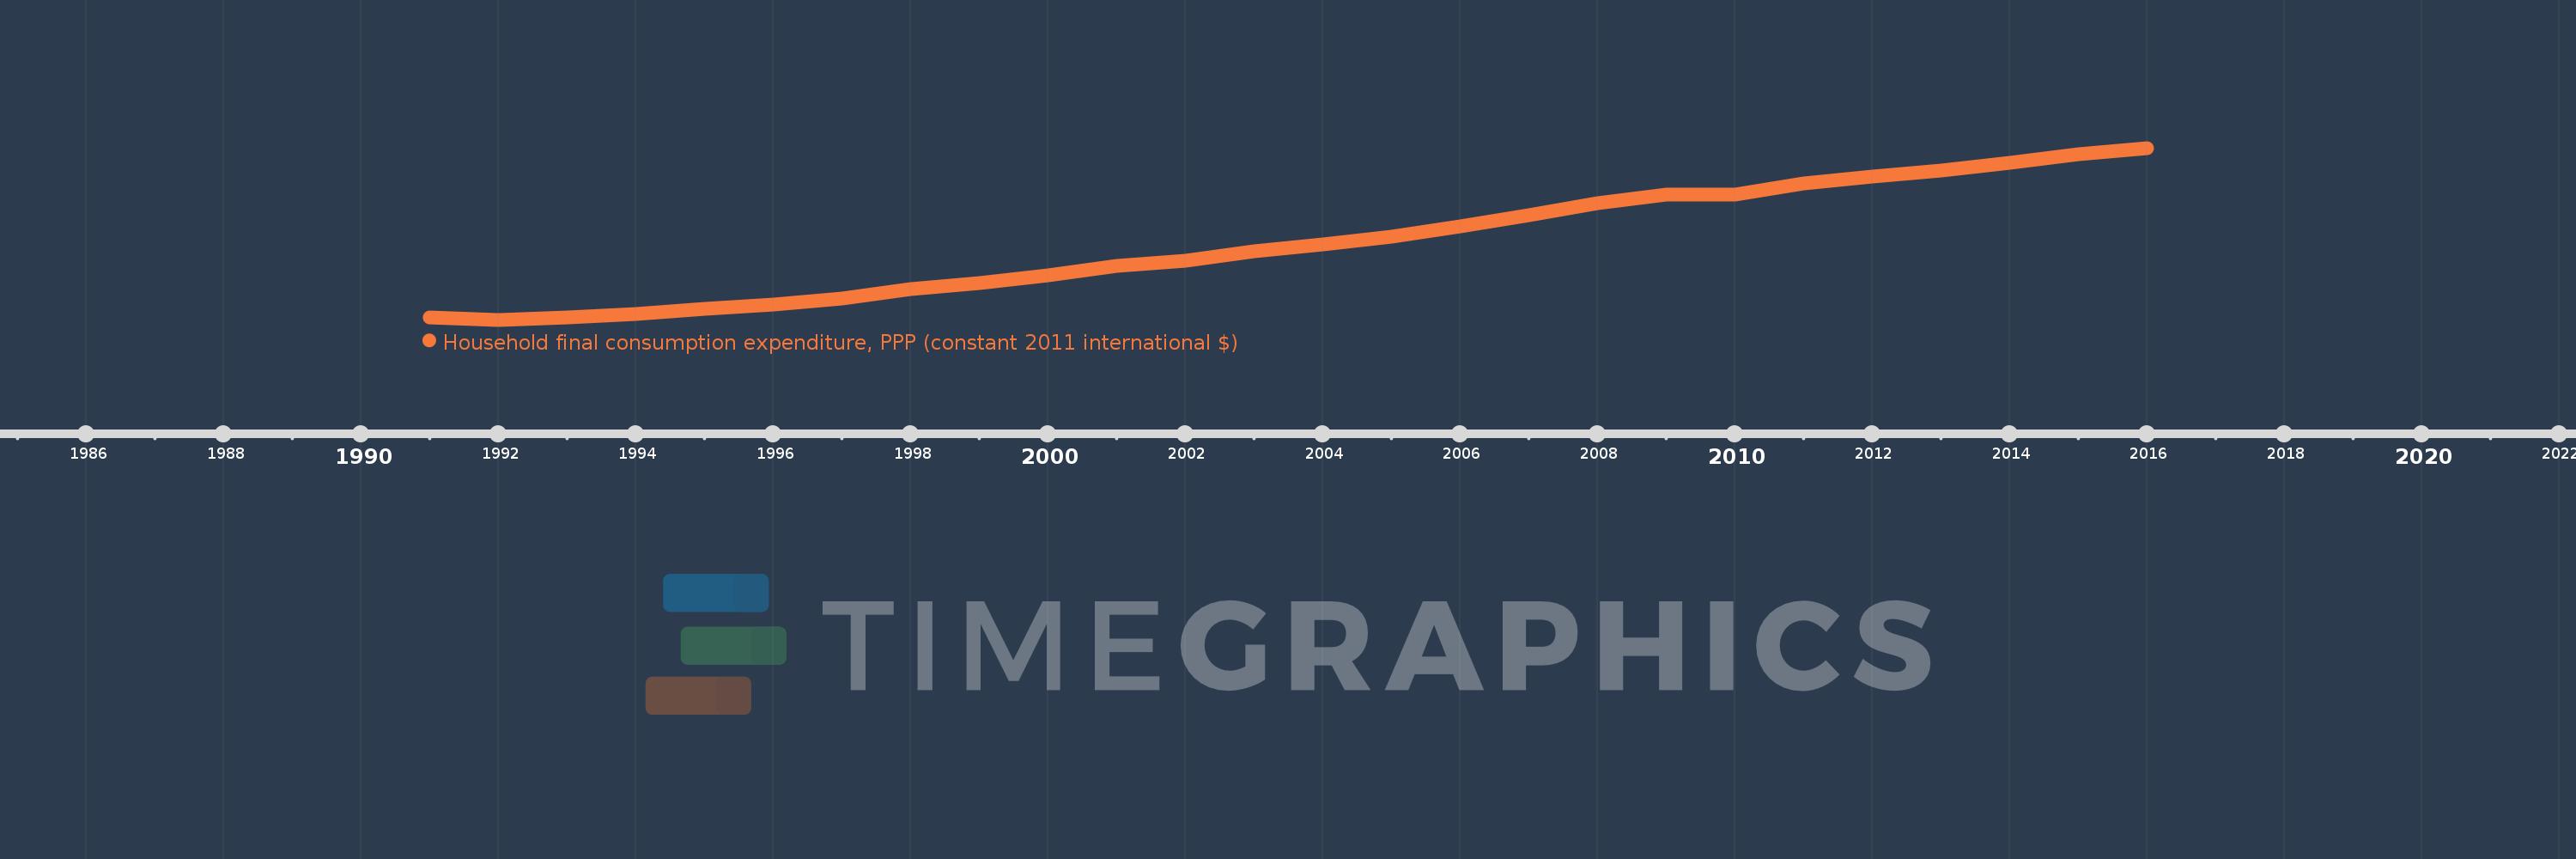
Household final consumption expenditure, PPP (constant 2011 international $)
2016,2015,2014,2013,2012,2011,2010,2009,2008,2007,2006,2005,2004,2003,2002,2001,2000,1999,1998,1997,1996,1995,1994,1993,1992,1991
This statistics in other country:
AfghanistanAlbaniaAlgeriaAngolaAntigua and BarbudaArab WorldArgentinaArmeniaArubaAustraliaAustriaAzerbaijanBahamas, TheBahrainBangladeshBarbadosBelarusBelgiumBelizeBeninBermudaBhutanBoliviaBosnia and HerzegovinaBotswanaBrazilBrunei DarussalamBulgariaBurkina FasoBurundiCabo VerdeCambodiaCameroonCanadaCaribbean small statesCentral African RepublicCentral Europe and the BalticsChadChileChinaColombiaComorosCongo, Dem. Rep.Congo, Rep.Costa RicaCote d'IvoireCroatiaCubaCyprusCzech RepublicDenmarkDominicaDominican RepublicEarly-demographic dividendEast Asia & PacificEast Asia & Pacific (excluding high income)East Asia & Pacific (IDA & IBRD countries)EcuadorEgypt, Arab Rep.El SalvadorEquatorial GuineaEritreaEstoniaEthiopiaEuro areaEurope & Central AsiaEurope & Central Asia (excluding high income)Europe & Central Asia (IDA & IBRD countries)European UnionFinlandFranceGabonGambia, TheGeorgiaGermanyGhanaGreeceGrenadaGuatemalaGuineaGuinea-BissauGuyanaHaitiHeavily indebted poor countries (HIPC)High incomeHondurasHong Kong SAR, ChinaHungaryIBRD onlyIcelandIDA & IBRD totalIDA blendIDA onlyIDA totalIndiaIndonesiaIran, Islamic Rep.IrelandIsraelItalyJamaicaJapanJordanKazakhstanKenyaKorea, Rep.KosovoKuwaitKyrgyz RepublicLao PDRLate-demographic dividendLatin America & Caribbean Latin America & Caribbean (excluding high income)Latin America & the Caribbean (IDA & IBRD countries)LatviaLebanonLiberiaLithuaniaLow & middle incomeLow incomeLower middle incomeLuxembourgMacao SAR, ChinaMacedonia, FYRMadagascarMalawiMalaysiaMaliMaltaMauritaniaMauritiusMexicoMiddle East & North AfricaMiddle East & North Africa (excluding high income)Middle East & North Africa (IDA & IBRD countries)Middle incomeMoldovaMongoliaMontenegroMoroccoMozambiqueNamibiaNepalNetherlandsNew ZealandNicaraguaNigerNigeriaNorth AmericaNorwayOECD membersOmanOther small statesPakistanPanamaParaguayPeruPhilippinesPolandPortugalPost-demographic dividendPre-demographic dividendPuerto RicoQatarRomaniaRussian FederationRwandaSaudi ArabiaSenegalSerbiaSeychellesSierra LeoneSingaporeSlovak RepublicSloveniaSmall statesSouth AfricaSouth AsiaSouth Asia (IDA & IBRD)South SudanSpainSri LankaSt. Kitts and NevisSt. LuciaSt. Vincent and the GrenadinesSub-Saharan Africa Sub-Saharan Africa (excluding high income)Sub-Saharan Africa (IDA & IBRD countries)SudanSurinameSwazilandSwedenSwitzerlandTajikistanTanzaniaThailandTimor-LesteTogoTongaTrinidad and TobagoTunisiaTurkeyTurkmenistanUgandaUkraineUnited Arab EmiratesUnited KingdomUnited StatesUpper middle incomeUruguayUzbekistanVanuatuVenezuela, RBVietnamWest Bank and GazaWorldYemen, Rep.ZambiaZimbabwe Timeline:
This timeline shows a graph from 1991 to 2016 of Canada. No data until 1990. Number of actual observations by date: 26.
Source name:
World Development Indicators
Source organization:
World Bank, International Comparison Program database.
Categories, topics:
Economy & Growth
Last updated:
apr 23, 2017
Indicators value changes by year
Minimum:
423.871 bln
jan 1, 1992
Maximum:
838.938 bln
jan 1, 2016
At the date of observation
Value
Absolute change
Change from previous value
jan 1, 1991
428.723 bln
+428.723 bln
0.0%
jan 1, 1992
423.871 bln
-4.852 bln
-1.13%
jan 1, 1993
430.363 bln
+6.492 bln
1.53%
jan 1, 1994
438.29 bln
+7.927 bln
1.84%
jan 1, 1995
450.922 bln
+12.632 bln
2.88%
jan 1, 1996
461.018 bln
+10.096 bln
2.24%
jan 1, 1997
474.666 bln
+13.649 bln
2.96%
jan 1, 1998
497.914 bln
+23.248 bln
4.9%
jan 1, 1999
511.579 bln
+13.665 bln
2.74%
jan 1, 2000
531.745 bln
+20.166 bln
3.94%
jan 1, 2001
553.331 bln
+21.586 bln
4.06%
jan 1, 2002
566.846 bln
+13.516 bln
2.44%
jan 1, 2003
589.462 bln
+22.615 bln
3.99%
jan 1, 2004
605.689 bln
+16.228 bln
2.75%
jan 1, 2005
624.094 bln
+18.404 bln
3.04%
jan 1, 2006
648.614 bln
+24.521 bln
3.93%
jan 1, 2007
675.672 bln
+27.058 bln
4.17%
jan 1, 2008
705.303 bln
+29.63 bln
4.39%
jan 1, 2009
726.17 bln
+20.868 bln
2.96%
jan 1, 2010
726.391 bln
+220.523 mln
0.03%
jan 1, 2011
752.331 bln
+25.941 bln
3.57%
jan 1, 2012
769.57 bln
+17.238 bln
2.29%
jan 1, 2013
784.305 bln
+14.736 bln
1.91%
jan 1, 2014
803.111 bln
+18.805 bln
2.4%
jan 1, 2015
823.447 bln
+20.336 bln
2.53%
jan 1, 2016
838.938 bln
+15.491 bln
1.88%
Ranking of countries by current statistics by years


Comments: