29
/
en
AIzaSyAYiBZKx7MnpbEhh9jyipgxe19OcubqV5w
April 1, 2024
160590
Israel
ISR
true
2
1
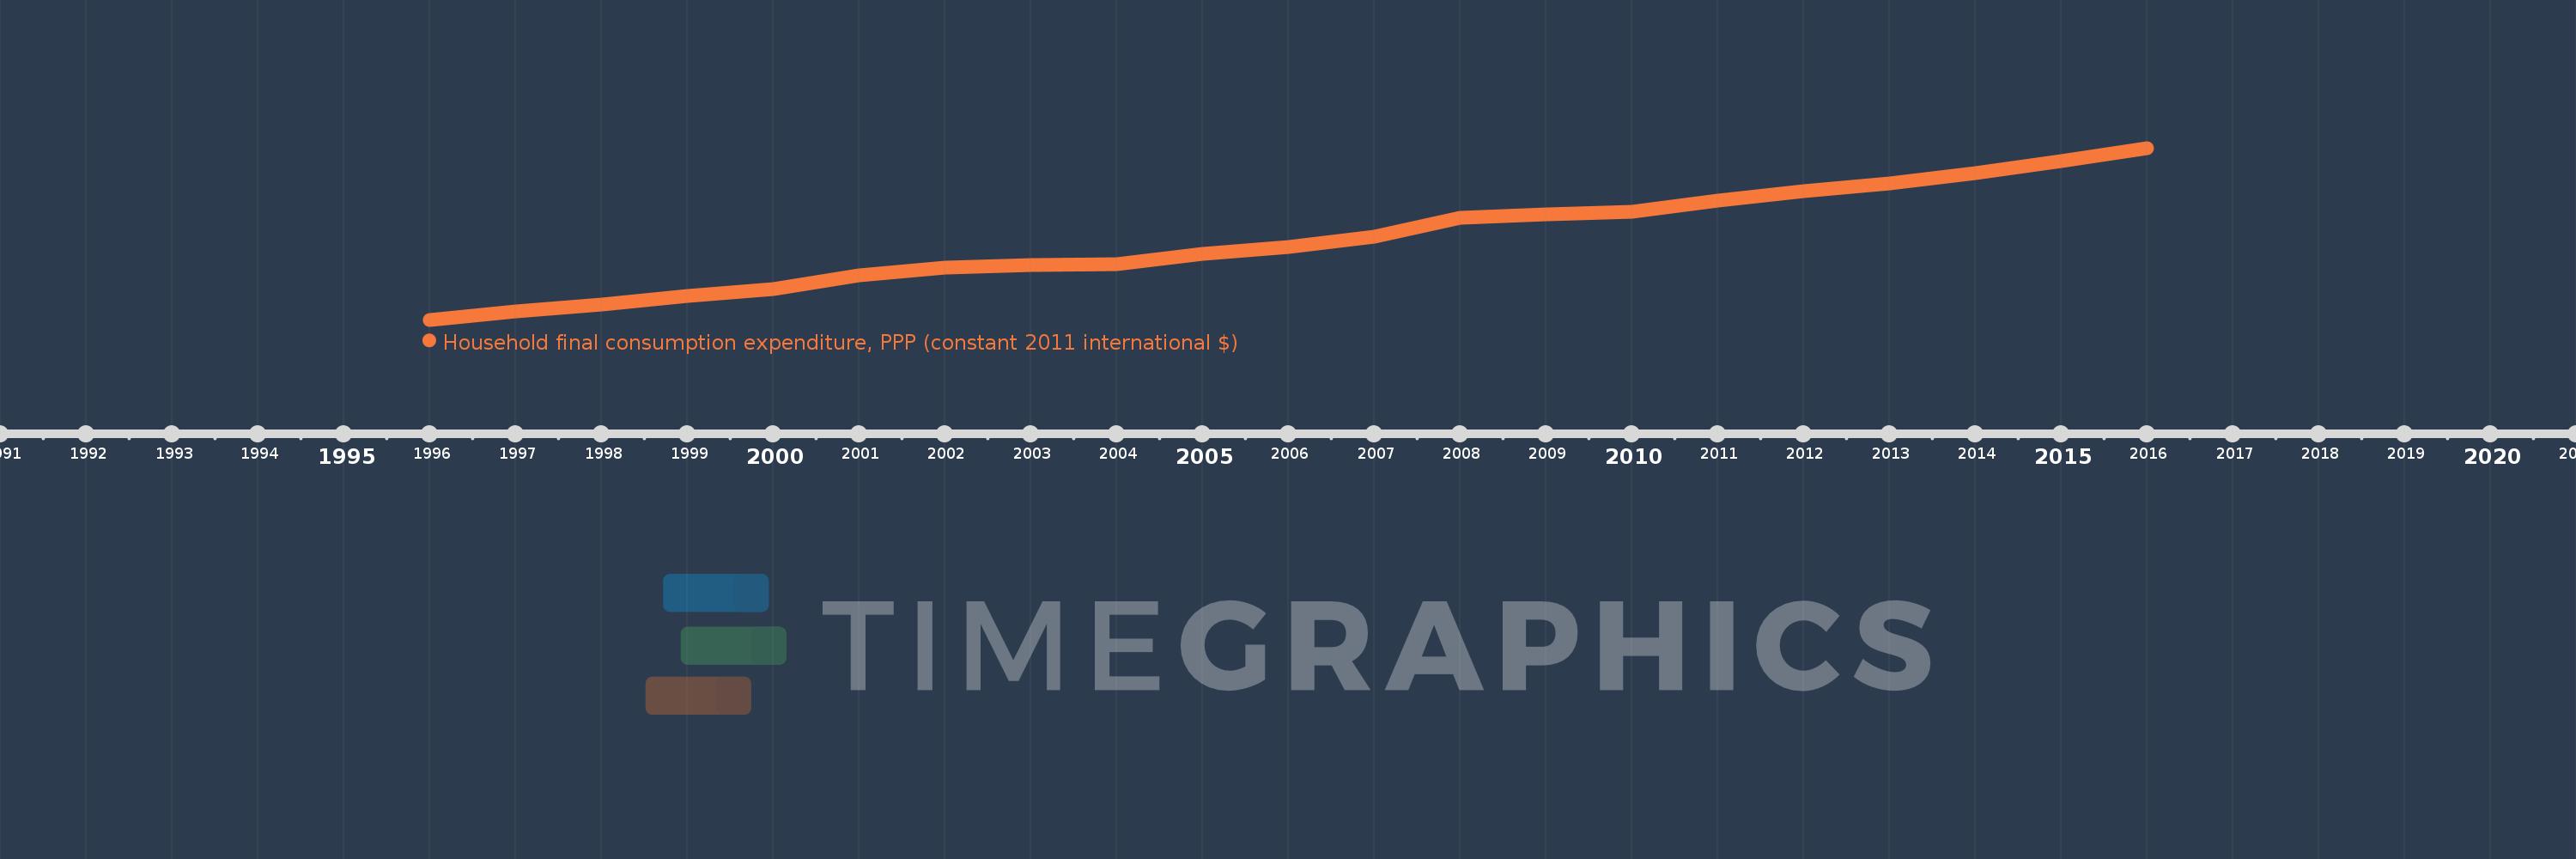
Household final consumption expenditure, PPP (constant 2011 international $)
2016,2015,2014,2013,2012,2011,2010,2009,2008,2007,2006,2005,2004,2003,2002,2001,2000,1999,1998,1997,1996
This statistics in other country:
AfghanistanAlbaniaAlgeriaAngolaAntigua and BarbudaArab WorldArgentinaArmeniaArubaAustraliaAustriaAzerbaijanBahamas, TheBahrainBangladeshBarbadosBelarusBelgiumBelizeBeninBermudaBhutanBoliviaBosnia and HerzegovinaBotswanaBrazilBrunei DarussalamBulgariaBurkina FasoBurundiCabo VerdeCambodiaCameroonCanadaCaribbean small statesCentral African RepublicCentral Europe and the BalticsChadChileChinaColombiaComorosCongo, Dem. Rep.Congo, Rep.Costa RicaCote d'IvoireCroatiaCubaCyprusCzech RepublicDenmarkDominicaDominican RepublicEarly-demographic dividendEast Asia & PacificEast Asia & Pacific (excluding high income)East Asia & Pacific (IDA & IBRD countries)EcuadorEgypt, Arab Rep.El SalvadorEquatorial GuineaEritreaEstoniaEthiopiaEuro areaEurope & Central AsiaEurope & Central Asia (excluding high income)Europe & Central Asia (IDA & IBRD countries)European UnionFinlandFranceGabonGambia, TheGeorgiaGermanyGhanaGreeceGrenadaGuatemalaGuineaGuinea-BissauGuyanaHaitiHeavily indebted poor countries (HIPC)High incomeHondurasHong Kong SAR, ChinaHungaryIBRD onlyIcelandIDA & IBRD totalIDA blendIDA onlyIDA totalIndiaIndonesiaIran, Islamic Rep.IrelandIsraelItalyJamaicaJapanJordanKazakhstanKenyaKorea, Rep.KosovoKuwaitKyrgyz RepublicLao PDRLate-demographic dividendLatin America & Caribbean Latin America & Caribbean (excluding high income)Latin America & the Caribbean (IDA & IBRD countries)LatviaLebanonLiberiaLithuaniaLow & middle incomeLow incomeLower middle incomeLuxembourgMacao SAR, ChinaMacedonia, FYRMadagascarMalawiMalaysiaMaliMaltaMauritaniaMauritiusMexicoMiddle East & North AfricaMiddle East & North Africa (excluding high income)Middle East & North Africa (IDA & IBRD countries)Middle incomeMoldovaMongoliaMontenegroMoroccoMozambiqueNamibiaNepalNetherlandsNew ZealandNicaraguaNigerNigeriaNorth AmericaNorwayOECD membersOmanOther small statesPakistanPanamaParaguayPeruPhilippinesPolandPortugalPost-demographic dividendPre-demographic dividendPuerto RicoQatarRomaniaRussian FederationRwandaSaudi ArabiaSenegalSerbiaSeychellesSierra LeoneSingaporeSlovak RepublicSloveniaSmall statesSouth AfricaSouth AsiaSouth Asia (IDA & IBRD)South SudanSpainSri LankaSt. Kitts and NevisSt. LuciaSt. Vincent and the GrenadinesSub-Saharan Africa Sub-Saharan Africa (excluding high income)Sub-Saharan Africa (IDA & IBRD countries)SudanSurinameSwazilandSwedenSwitzerlandTajikistanTanzaniaThailandTimor-LesteTogoTongaTrinidad and TobagoTunisiaTurkeyTurkmenistanUgandaUkraineUnited Arab EmiratesUnited KingdomUnited StatesUpper middle incomeUruguayUzbekistanVanuatuVenezuela, RBVietnamWest Bank and GazaWorldYemen, Rep.ZambiaZimbabwe Timeline:
This timeline shows a graph from 1996 to 2016 of Israel. No data until 1995. Number of actual observations by date: 21.
Source name:
World Development Indicators
Source organization:
World Bank, International Comparison Program database.
Categories, topics:
Economy & Growth
Last updated:
apr 23, 2017
Indicators value changes by year
Minimum:
64.457 bln
jan 1, 1996
Maximum:
144.212 bln
jan 1, 2016
At the date of observation
Value
Absolute change
Change from previous value
jan 1, 1996
64.457 bln
+64.457 bln
0.0%
jan 1, 1997
68.52 bln
+4.062 bln
6.3%
jan 1, 1998
71.345 bln
+2.826 bln
4.12%
jan 1, 1999
75.5 bln
+4.155 bln
5.82%
jan 1, 2000
78.614 bln
+3.114 bln
4.12%
jan 1, 2001
85.224 bln
+6.61 bln
8.41%
jan 1, 2002
88.614 bln
+3.39 bln
3.98%
jan 1, 2003
90.009 bln
+1.395 bln
1.57%
jan 1, 2004
90.154 bln
+145.348 mln
0.16%
jan 1, 2005
94.927 bln
+4.773 bln
5.29%
jan 1, 2006
98.194 bln
+3.267 bln
3.44%
jan 1, 2007
103.11 bln
+4.916 bln
5.01%
jan 1, 2008
111.646 bln
+8.536 bln
8.28%
jan 1, 2009
113.226 bln
+1.581 bln
1.42%
jan 1, 2010
114.404 bln
+1.178 bln
1.04%
jan 1, 2011
119.88 bln
+5.476 bln
4.79%
jan 1, 2012
124.18 bln
+4.3 bln
3.59%
jan 1, 2013
127.773 bln
+3.593 bln
2.89%
jan 1, 2014
132.602 bln
+4.829 bln
3.78%
jan 1, 2015
138.259 bln
+5.657 bln
4.27%
jan 1, 2016
144.212 bln
+5.953 bln
4.31%
Ranking of countries by current statistics by years


Comments: