29
/
en
AIzaSyAYiBZKx7MnpbEhh9jyipgxe19OcubqV5w
April 1, 2024
183971
Macedonia, FYR
MKD
true
2
1
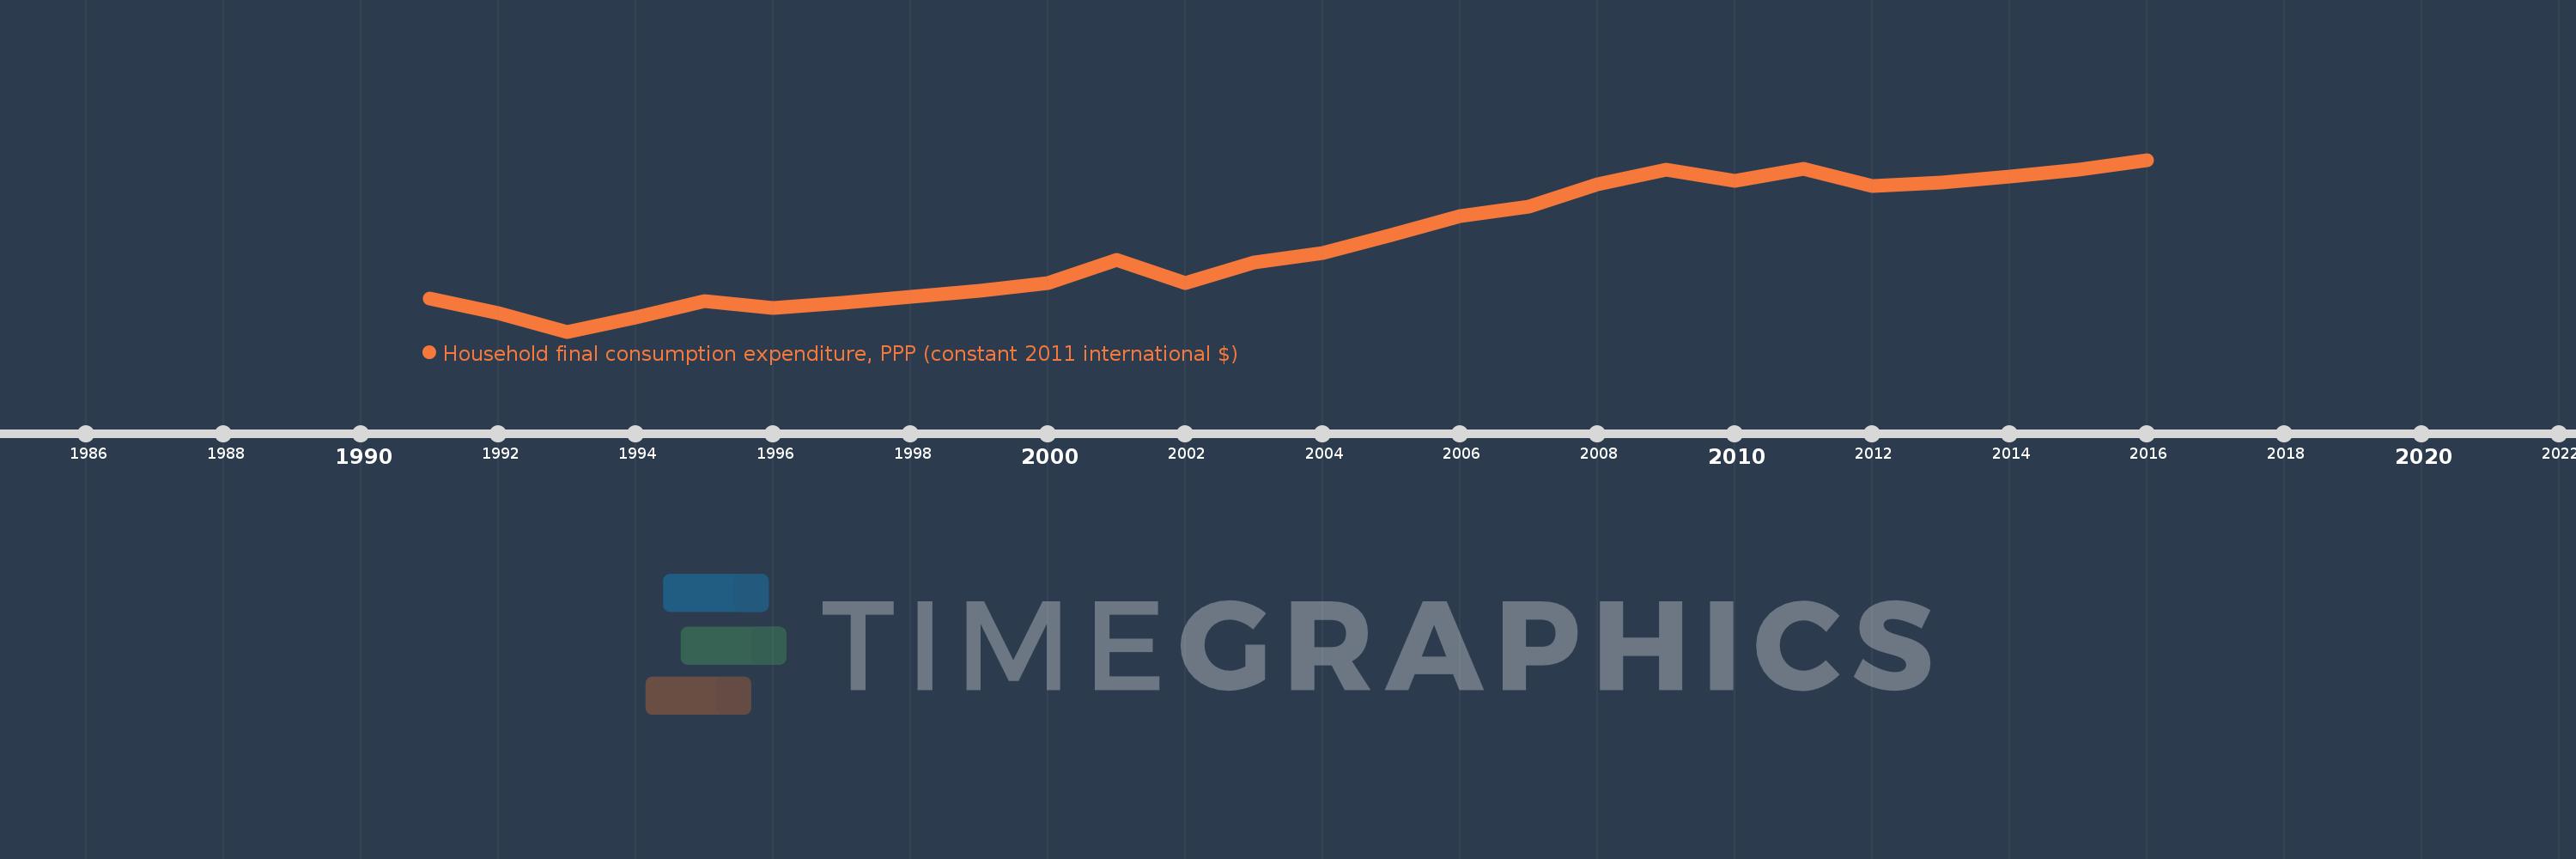
Household final consumption expenditure, PPP (constant 2011 international $)
2016,2015,2014,2013,2012,2011,2010,2009,2008,2007,2006,2005,2004,2003,2002,2001,2000,1999,1998,1997,1996,1995,1994,1993,1992,1991
This statistics in other country:
AfghanistanAlbaniaAlgeriaAngolaAntigua and BarbudaArab WorldArgentinaArmeniaArubaAustraliaAustriaAzerbaijanBahamas, TheBahrainBangladeshBarbadosBelarusBelgiumBelizeBeninBermudaBhutanBoliviaBosnia and HerzegovinaBotswanaBrazilBrunei DarussalamBulgariaBurkina FasoBurundiCabo VerdeCambodiaCameroonCanadaCaribbean small statesCentral African RepublicCentral Europe and the BalticsChadChileChinaColombiaComorosCongo, Dem. Rep.Congo, Rep.Costa RicaCote d'IvoireCroatiaCubaCyprusCzech RepublicDenmarkDominicaDominican RepublicEarly-demographic dividendEast Asia & PacificEast Asia & Pacific (excluding high income)East Asia & Pacific (IDA & IBRD countries)EcuadorEgypt, Arab Rep.El SalvadorEquatorial GuineaEritreaEstoniaEthiopiaEuro areaEurope & Central AsiaEurope & Central Asia (excluding high income)Europe & Central Asia (IDA & IBRD countries)European UnionFinlandFranceGabonGambia, TheGeorgiaGermanyGhanaGreeceGrenadaGuatemalaGuineaGuinea-BissauGuyanaHaitiHeavily indebted poor countries (HIPC)High incomeHondurasHong Kong SAR, ChinaHungaryIBRD onlyIcelandIDA & IBRD totalIDA blendIDA onlyIDA totalIndiaIndonesiaIran, Islamic Rep.IrelandIsraelItalyJamaicaJapanJordanKazakhstanKenyaKorea, Rep.KosovoKuwaitKyrgyz RepublicLao PDRLate-demographic dividendLatin America & Caribbean Latin America & Caribbean (excluding high income)Latin America & the Caribbean (IDA & IBRD countries)LatviaLebanonLiberiaLithuaniaLow & middle incomeLow incomeLower middle incomeLuxembourgMacao SAR, ChinaMacedonia, FYRMadagascarMalawiMalaysiaMaliMaltaMauritaniaMauritiusMexicoMiddle East & North AfricaMiddle East & North Africa (excluding high income)Middle East & North Africa (IDA & IBRD countries)Middle incomeMoldovaMongoliaMontenegroMoroccoMozambiqueNamibiaNepalNetherlandsNew ZealandNicaraguaNigerNigeriaNorth AmericaNorwayOECD membersOmanOther small statesPakistanPanamaParaguayPeruPhilippinesPolandPortugalPost-demographic dividendPre-demographic dividendPuerto RicoQatarRomaniaRussian FederationRwandaSaudi ArabiaSenegalSerbiaSeychellesSierra LeoneSingaporeSlovak RepublicSloveniaSmall statesSouth AfricaSouth AsiaSouth Asia (IDA & IBRD)South SudanSpainSri LankaSt. Kitts and NevisSt. LuciaSt. Vincent and the GrenadinesSub-Saharan Africa Sub-Saharan Africa (excluding high income)Sub-Saharan Africa (IDA & IBRD countries)SudanSurinameSwazilandSwedenSwitzerlandTajikistanTanzaniaThailandTimor-LesteTogoTongaTrinidad and TobagoTunisiaTurkeyTurkmenistanUgandaUkraineUnited Arab EmiratesUnited KingdomUnited StatesUpper middle incomeUruguayUzbekistanVanuatuVenezuela, RBVietnamWest Bank and GazaWorldYemen, Rep.ZambiaZimbabwe Timeline:
This timeline shows a graph from 1991 to 2016 of Macedonia, FYR. No data until 1990. Number of actual observations by date: 26.
Source name:
World Development Indicators
Source organization:
World Bank, International Comparison Program database.
Categories, topics:
Economy & Growth
Last updated:
apr 23, 2017
Indicators value changes by year
Minimum:
7.484 bln
jan 1, 1993
Maximum:
15.564 bln
jan 1, 2016
At the date of observation
Value
Absolute change
Change from previous value
jan 1, 1991
9.047 bln
+9.047 bln
0.0%
jan 1, 1992
8.341 bln
-705.658 mln
-7.8%
jan 1, 1993
7.484 bln
-857.071 mln
-10.28%
jan 1, 1994
8.169 bln
+684.664 mln
9.15%
jan 1, 1995
8.905 bln
+736.07 mln
9.01%
jan 1, 1996
8.583 bln
-321.95 mln
-3.62%
jan 1, 1997
8.838 bln
+254.871 mln
2.97%
jan 1, 1998
9.112 bln
+273.995 mln
3.1%
jan 1, 1999
9.415 bln
+303.185 mln
3.33%
jan 1, 2000
9.751 bln
+335.682 mln
3.57%
jan 1, 2001
10.843 bln
+1.092 bln
11.2%
jan 1, 2002
9.748 bln
-1.095 bln
-10.1%
jan 1, 2003
10.716 bln
+968.758 mln
9.94%
jan 1, 2004
11.198 bln
+481.354 mln
4.49%
jan 1, 2005
12.037 bln
+838.902 mln
7.49%
jan 1, 2006
12.9 bln
+863.465 mln
7.17%
jan 1, 2007
13.38 bln
+480.103 mln
3.72%
jan 1, 2008
14.399 bln
+1.019 bln
7.61%
jan 1, 2009
15.088 bln
+689.385 mln
4.79%
jan 1, 2010
14.589 bln
-498.616 mln
-3.3%
jan 1, 2011
15.14 bln
+550.872 mln
3.78%
jan 1, 2012
14.329 bln
-811.471 mln
-5.36%
jan 1, 2013
14.501 bln
+171.838 mln
1.2%
jan 1, 2014
14.771 bln
+269.83 mln
1.86%
jan 1, 2015
15.083 bln
+311.977 mln
2.11%
jan 1, 2016
15.564 bln
+481.064 mln
3.19%
Ranking of countries by current statistics by years


Comments: