29
/
en
AIzaSyAYiBZKx7MnpbEhh9jyipgxe19OcubqV5w
April 1, 2024
59861
Sub-Saharan Africa (excluding high income)
SSA
false
2
1
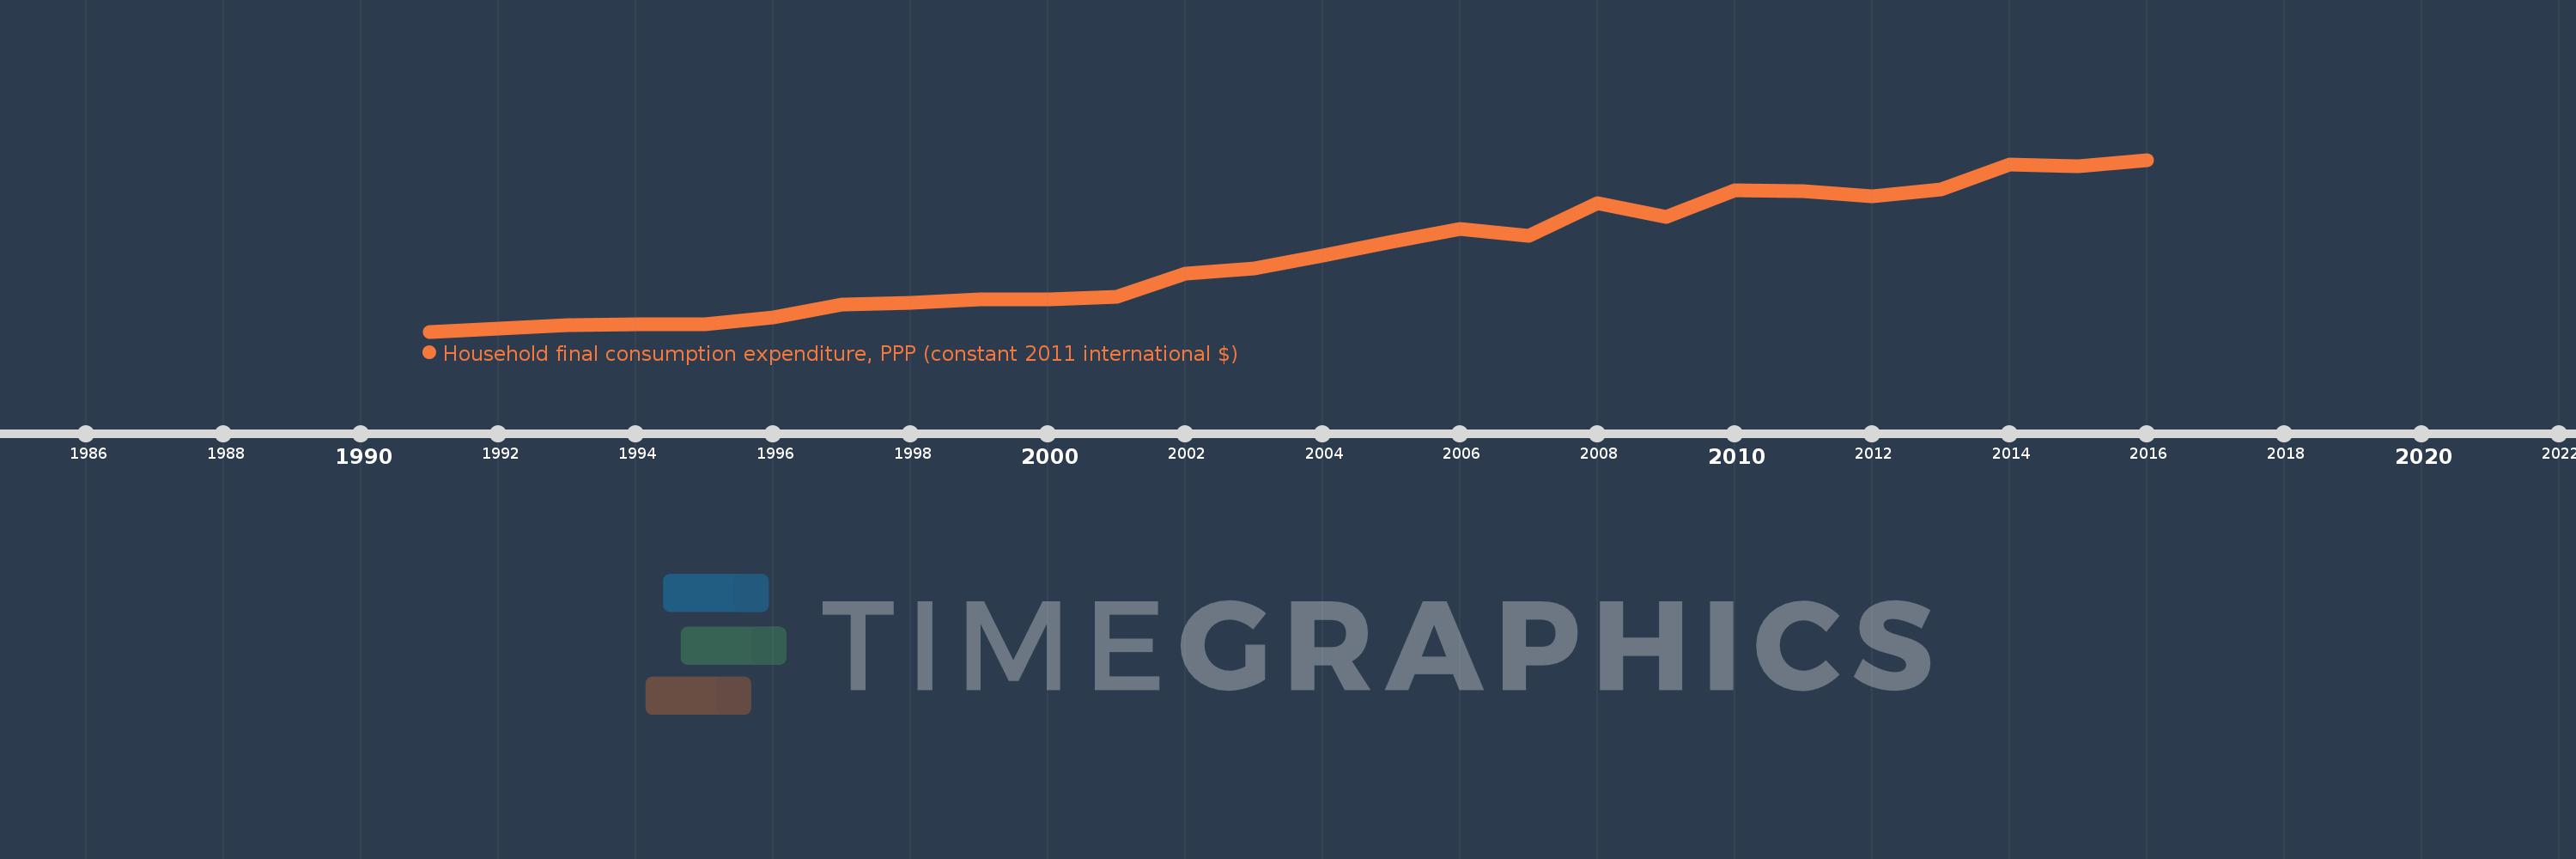
Household final consumption expenditure, PPP (constant 2011 international $)
2016,2015,2014,2013,2012,2011,2010,2009,2008,2007,2006,2005,2004,2003,2002,2001,2000,1999,1998,1997,1996,1995,1994,1993,1992,1991
This statistics in other country:
AfghanistanAlbaniaAlgeriaAngolaAntigua and BarbudaArab WorldArgentinaArmeniaArubaAustraliaAustriaAzerbaijanBahamas, TheBahrainBangladeshBarbadosBelarusBelgiumBelizeBeninBermudaBhutanBoliviaBosnia and HerzegovinaBotswanaBrazilBrunei DarussalamBulgariaBurkina FasoBurundiCabo VerdeCambodiaCameroonCanadaCaribbean small statesCentral African RepublicCentral Europe and the BalticsChadChileChinaColombiaComorosCongo, Dem. Rep.Congo, Rep.Costa RicaCote d'IvoireCroatiaCubaCyprusCzech RepublicDenmarkDominicaDominican RepublicEarly-demographic dividendEast Asia & PacificEast Asia & Pacific (excluding high income)East Asia & Pacific (IDA & IBRD countries)EcuadorEgypt, Arab Rep.El SalvadorEquatorial GuineaEritreaEstoniaEthiopiaEuro areaEurope & Central AsiaEurope & Central Asia (excluding high income)Europe & Central Asia (IDA & IBRD countries)European UnionFinlandFranceGabonGambia, TheGeorgiaGermanyGhanaGreeceGrenadaGuatemalaGuineaGuinea-BissauGuyanaHaitiHeavily indebted poor countries (HIPC)High incomeHondurasHong Kong SAR, ChinaHungaryIBRD onlyIcelandIDA & IBRD totalIDA blendIDA onlyIDA totalIndiaIndonesiaIran, Islamic Rep.IrelandIsraelItalyJamaicaJapanJordanKazakhstanKenyaKorea, Rep.KosovoKuwaitKyrgyz RepublicLao PDRLate-demographic dividendLatin America & Caribbean Latin America & Caribbean (excluding high income)Latin America & the Caribbean (IDA & IBRD countries)LatviaLebanonLiberiaLithuaniaLow & middle incomeLow incomeLower middle incomeLuxembourgMacao SAR, ChinaMacedonia, FYRMadagascarMalawiMalaysiaMaliMaltaMauritaniaMauritiusMexicoMiddle East & North AfricaMiddle East & North Africa (excluding high income)Middle East & North Africa (IDA & IBRD countries)Middle incomeMoldovaMongoliaMontenegroMoroccoMozambiqueNamibiaNepalNetherlandsNew ZealandNicaraguaNigerNigeriaNorth AmericaNorwayOECD membersOmanOther small statesPakistanPanamaParaguayPeruPhilippinesPolandPortugalPost-demographic dividendPre-demographic dividendPuerto RicoQatarRomaniaRussian FederationRwandaSaudi ArabiaSenegalSerbiaSeychellesSierra LeoneSingaporeSlovak RepublicSloveniaSmall statesSouth AfricaSouth AsiaSouth Asia (IDA & IBRD)South SudanSpainSri LankaSt. Kitts and NevisSt. LuciaSt. Vincent and the GrenadinesSub-Saharan Africa Sub-Saharan Africa (excluding high income)Sub-Saharan Africa (IDA & IBRD countries)SudanSurinameSwazilandSwedenSwitzerlandTajikistanTanzaniaThailandTimor-LesteTogoTongaTrinidad and TobagoTunisiaTurkeyTurkmenistanUgandaUkraineUnited Arab EmiratesUnited KingdomUnited StatesUpper middle incomeUruguayUzbekistanVanuatuVenezuela, RBVietnamWest Bank and GazaWorldYemen, Rep.ZambiaZimbabwe Timeline:
This timeline shows a graph from 1991 to 2016 of Sub-Saharan Africa (excluding high income). No data until 1990. Number of actual observations by date: 26.
Source name:
World Development Indicators
Source organization:
World Bank, International Comparison Program database.
Categories, topics:
Economy & Growth
Last updated:
apr 23, 2017
Indicators value changes by year
Minimum:
804.99 bln
jan 1, 1991
Maximum:
2.024 trl
jan 1, 2016
At the date of observation
Value
Absolute change
Change from previous value
jan 1, 1991
804.99 bln
+804.99 bln
0.0%
jan 1, 1992
824.866 bln
+19.877 bln
2.47%
jan 1, 1993
851.394 bln
+26.527 bln
3.22%
jan 1, 1994
857.54 bln
+6.147 bln
0.72%
jan 1, 1995
859.466 bln
+1.926 bln
0.22%
jan 1, 1996
908.131 bln
+48.664 bln
5.66%
jan 1, 1997
995.599 bln
+87.468 bln
9.63%
jan 1, 1998
1.009 trl
+13.069 bln
1.31%
jan 1, 1999
1.035 trl
+26.558 bln
2.63%
jan 1, 2000
1.034 trl
-1.174 bln
-0.11%
jan 1, 2001
1.053 trl
+19.092 bln
1.85%
jan 1, 2002
1.217 trl
+163.962 bln
15.57%
jan 1, 2003
1.254 trl
+36.57 bln
3.0%
jan 1, 2004
1.345 trl
+91.572 bln
7.3%
jan 1, 2005
1.44 trl
+94.732 bln
7.04%
jan 1, 2006
1.533 trl
+92.814 bln
6.45%
jan 1, 2007
1.484 trl
-49.014 bln
-3.2%
jan 1, 2008
1.715 trl
+230.829 bln
15.56%
jan 1, 2009
1.619 trl
-95.654 bln
-5.58%
jan 1, 2010
1.809 trl
+190.073 bln
11.74%
jan 1, 2011
1.8 trl
-9.019 bln
-0.5%
jan 1, 2012
1.767 trl
-32.553 bln
-1.81%
jan 1, 2013
1.811 trl
+43.978 bln
2.49%
jan 1, 2014
1.99 trl
+178.748 bln
9.87%
jan 1, 2015
1.979 trl
-10.812 bln
-0.54%
jan 1, 2016
2.024 trl
+44.69 bln
2.26%
Ranking of countries by current statistics by years


Comments: