29
/
en
AIzaSyAYiBZKx7MnpbEhh9jyipgxe19OcubqV5w
April 1, 2024
224954
Poland
POL
true
2
1
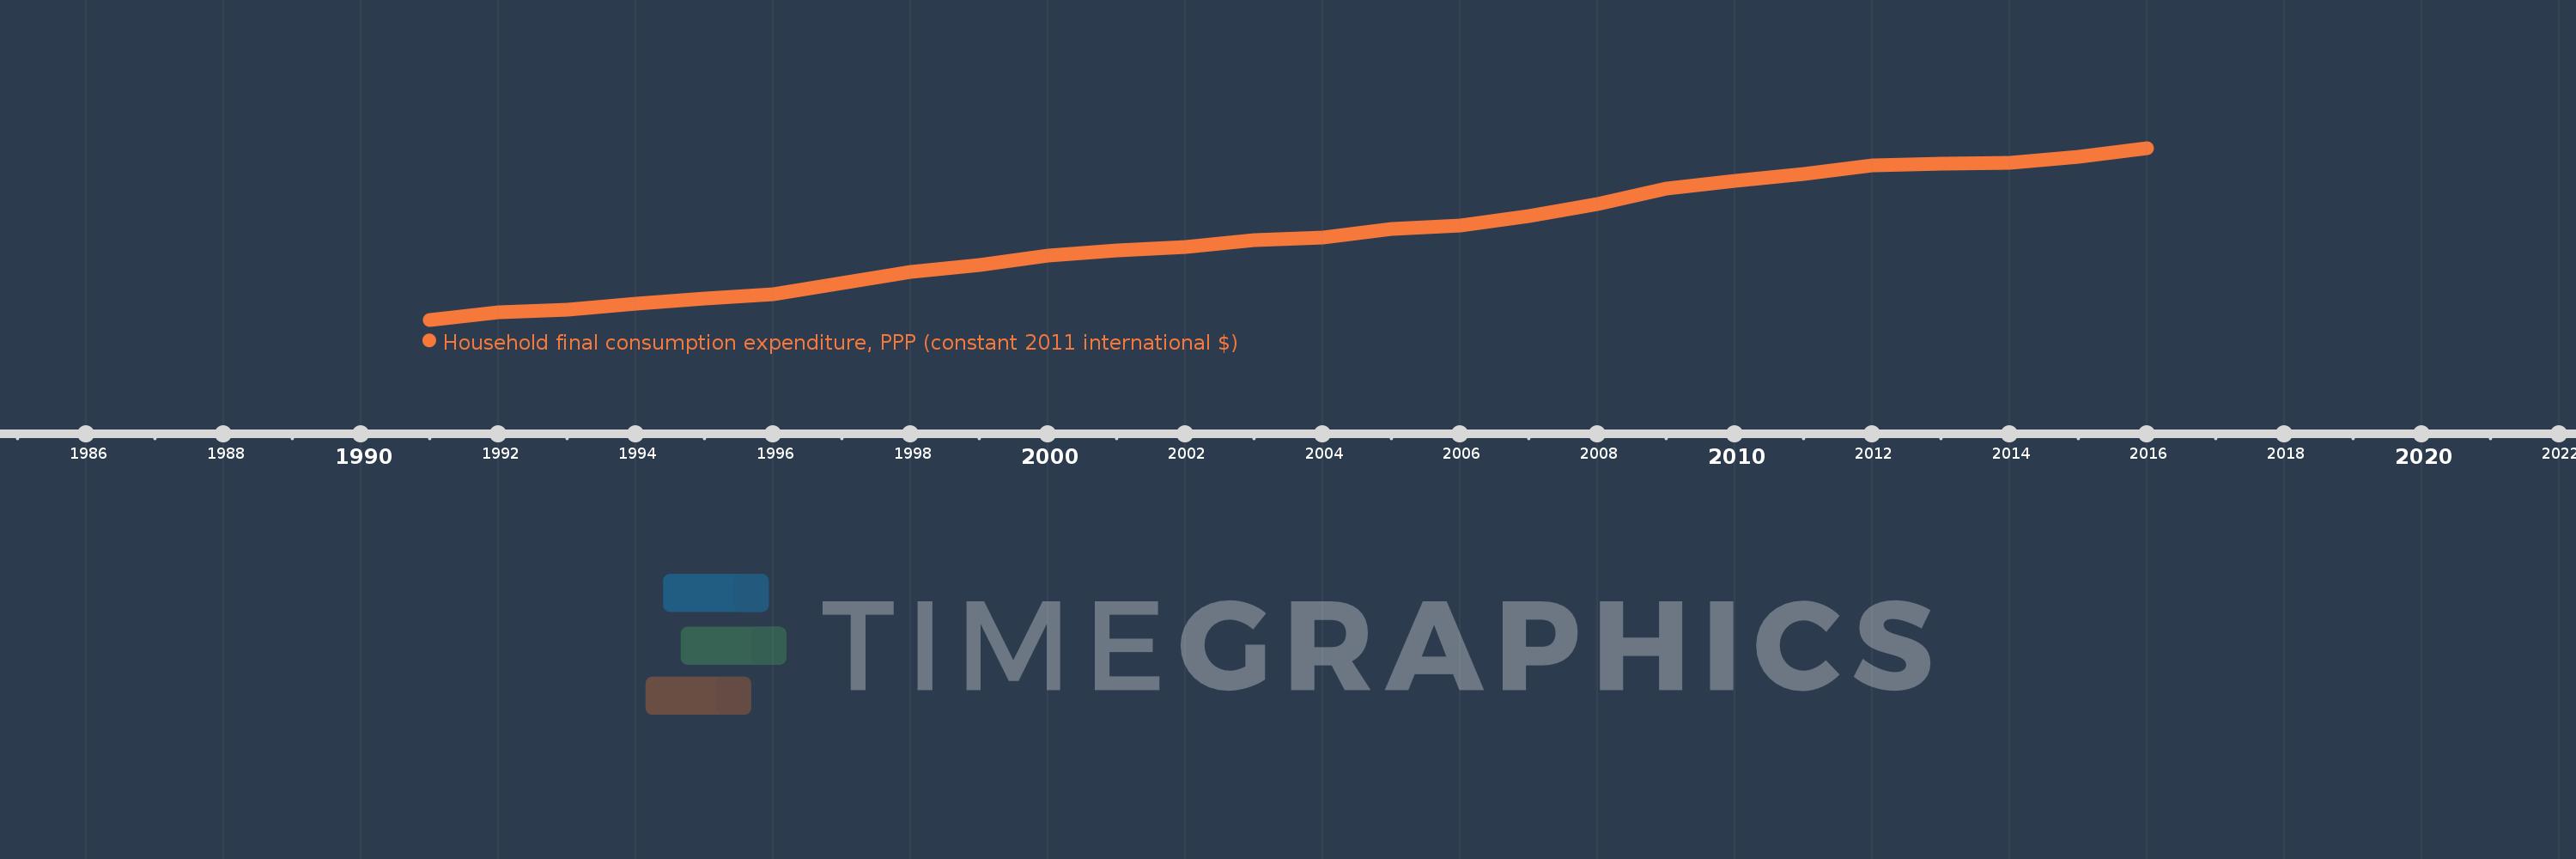
Household final consumption expenditure, PPP (constant 2011 international $)
2016,2015,2014,2013,2012,2011,2010,2009,2008,2007,2006,2005,2004,2003,2002,2001,2000,1999,1998,1997,1996,1995,1994,1993,1992,1991
This statistics in other country:
AfghanistanAlbaniaAlgeriaAngolaAntigua and BarbudaArab WorldArgentinaArmeniaArubaAustraliaAustriaAzerbaijanBahamas, TheBahrainBangladeshBarbadosBelarusBelgiumBelizeBeninBermudaBhutanBoliviaBosnia and HerzegovinaBotswanaBrazilBrunei DarussalamBulgariaBurkina FasoBurundiCabo VerdeCambodiaCameroonCanadaCaribbean small statesCentral African RepublicCentral Europe and the BalticsChadChileChinaColombiaComorosCongo, Dem. Rep.Congo, Rep.Costa RicaCote d'IvoireCroatiaCubaCyprusCzech RepublicDenmarkDominicaDominican RepublicEarly-demographic dividendEast Asia & PacificEast Asia & Pacific (excluding high income)East Asia & Pacific (IDA & IBRD countries)EcuadorEgypt, Arab Rep.El SalvadorEquatorial GuineaEritreaEstoniaEthiopiaEuro areaEurope & Central AsiaEurope & Central Asia (excluding high income)Europe & Central Asia (IDA & IBRD countries)European UnionFinlandFranceGabonGambia, TheGeorgiaGermanyGhanaGreeceGrenadaGuatemalaGuineaGuinea-BissauGuyanaHaitiHeavily indebted poor countries (HIPC)High incomeHondurasHong Kong SAR, ChinaHungaryIBRD onlyIcelandIDA & IBRD totalIDA blendIDA onlyIDA totalIndiaIndonesiaIran, Islamic Rep.IrelandIsraelItalyJamaicaJapanJordanKazakhstanKenyaKorea, Rep.KosovoKuwaitKyrgyz RepublicLao PDRLate-demographic dividendLatin America & Caribbean Latin America & Caribbean (excluding high income)Latin America & the Caribbean (IDA & IBRD countries)LatviaLebanonLiberiaLithuaniaLow & middle incomeLow incomeLower middle incomeLuxembourgMacao SAR, ChinaMacedonia, FYRMadagascarMalawiMalaysiaMaliMaltaMauritaniaMauritiusMexicoMiddle East & North AfricaMiddle East & North Africa (excluding high income)Middle East & North Africa (IDA & IBRD countries)Middle incomeMoldovaMongoliaMontenegroMoroccoMozambiqueNamibiaNepalNetherlandsNew ZealandNicaraguaNigerNigeriaNorth AmericaNorwayOECD membersOmanOther small statesPakistanPanamaParaguayPeruPhilippinesPolandPortugalPost-demographic dividendPre-demographic dividendPuerto RicoQatarRomaniaRussian FederationRwandaSaudi ArabiaSenegalSerbiaSeychellesSierra LeoneSingaporeSlovak RepublicSloveniaSmall statesSouth AfricaSouth AsiaSouth Asia (IDA & IBRD)South SudanSpainSri LankaSt. Kitts and NevisSt. LuciaSt. Vincent and the GrenadinesSub-Saharan Africa Sub-Saharan Africa (excluding high income)Sub-Saharan Africa (IDA & IBRD countries)SudanSurinameSwazilandSwedenSwitzerlandTajikistanTanzaniaThailandTimor-LesteTogoTongaTrinidad and TobagoTunisiaTurkeyTurkmenistanUgandaUkraineUnited Arab EmiratesUnited KingdomUnited StatesUpper middle incomeUruguayUzbekistanVanuatuVenezuela, RBVietnamWest Bank and GazaWorldYemen, Rep.ZambiaZimbabwe Timeline:
This timeline shows a graph from 1991 to 2016 of Poland. No data until 1990. Number of actual observations by date: 26.
Source name:
World Development Indicators
Source organization:
World Bank, International Comparison Program database.
Categories, topics:
Economy & Growth
Last updated:
apr 23, 2017
Indicators value changes by year
Minimum:
205.676 bln
jan 1, 1991
Maximum:
535.686 bln
jan 1, 2016
At the date of observation
Value
Absolute change
Change from previous value
jan 1, 1991
205.676 bln
+205.676 bln
0.0%
jan 1, 1992
219.286 bln
+13.61 bln
6.62%
jan 1, 1993
224.493 bln
+5.207 bln
2.37%
jan 1, 1994
236.527 bln
+12.034 bln
5.36%
jan 1, 1995
247.153 bln
+10.625 bln
4.49%
jan 1, 1996
254.982 bln
+7.829 bln
3.17%
jan 1, 1997
276.825 bln
+21.843 bln
8.57%
jan 1, 1998
297.143 bln
+20.318 bln
7.34%
jan 1, 1999
311.592 bln
+14.449 bln
4.86%
jan 1, 2000
328.767 bln
+17.175 bln
5.51%
jan 1, 2001
338.232 bln
+9.465 bln
2.88%
jan 1, 2002
345.016 bln
+6.783 bln
2.01%
jan 1, 2003
358.586 bln
+13.571 bln
3.93%
jan 1, 2004
364.276 bln
+5.69 bln
1.59%
jan 1, 2005
379.75 bln
+15.474 bln
4.25%
jan 1, 2006
386.493 bln
+6.743 bln
1.78%
jan 1, 2007
405.046 bln
+18.553 bln
4.8%
jan 1, 2008
427.928 bln
+22.883 bln
5.65%
jan 1, 2009
456.834 bln
+28.906 bln
6.75%
jan 1, 2010
473.228 bln
+16.394 bln
3.59%
jan 1, 2011
486.225 bln
+12.997 bln
2.75%
jan 1, 2012
501.536 bln
+15.31 bln
3.15%
jan 1, 2013
505.289 bln
+3.754 bln
0.75%
jan 1, 2014
506.93 bln
+1.64 bln
0.32%
jan 1, 2015
519.073 bln
+12.144 bln
2.4%
jan 1, 2016
535.686 bln
+16.613 bln
3.2%
Ranking of countries by current statistics by years


Comments: