29
/
en
AIzaSyAYiBZKx7MnpbEhh9jyipgxe19OcubqV5w
April 1, 2024
237227
Serbia
SRB
true
2
1
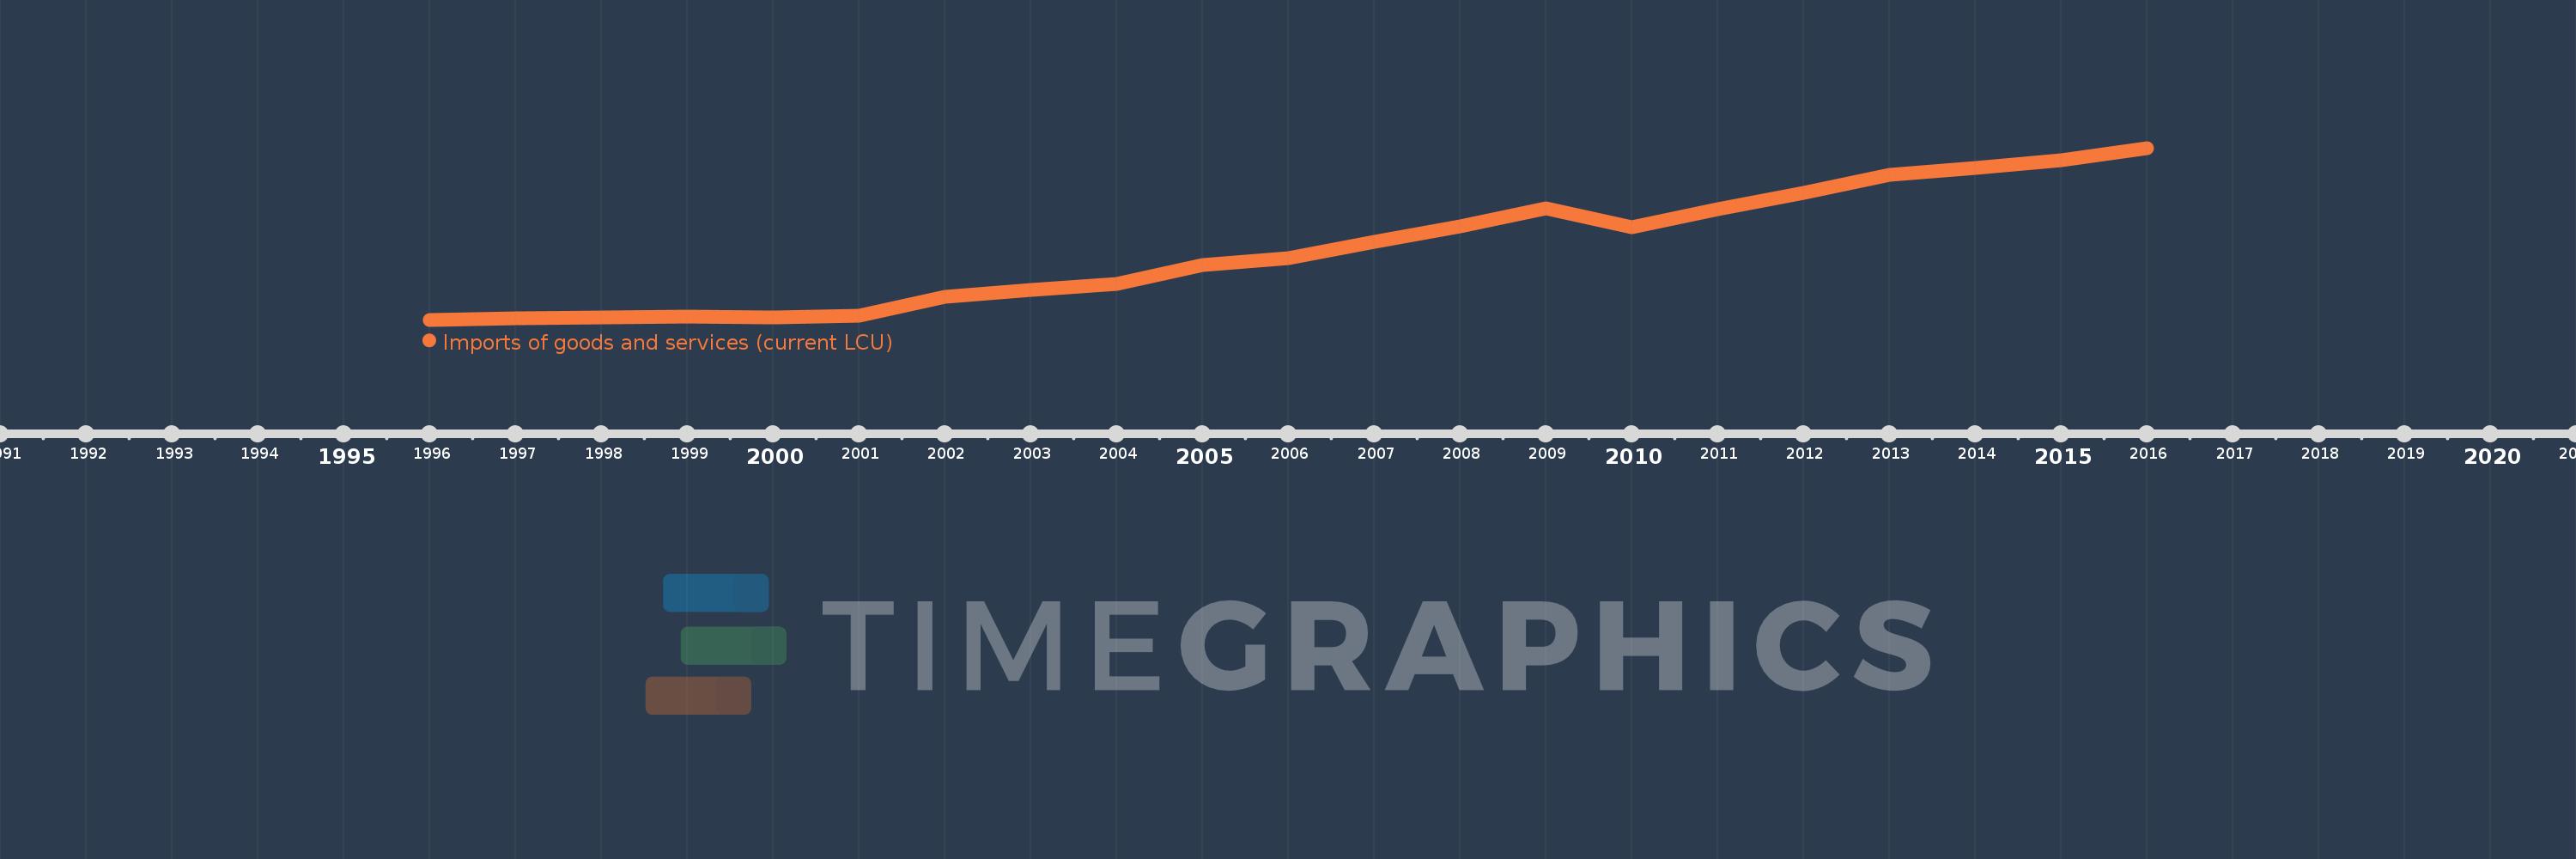
Imports of goods and services (current LCU)
2016,2015,2014,2013,2012,2011,2010,2009,2008,2007,2006,2005,2004,2003,2002,2001,2000,1999,1998,1997,1996
This statistics in other country:
AfghanistanAlbaniaAlgeriaAngolaAntigua and BarbudaArgentinaArmeniaArubaAustraliaAustriaAzerbaijanBahamas, TheBahrainBangladeshBarbadosBelarusBelgiumBelizeBeninBermudaBhutanBoliviaBosnia and HerzegovinaBotswanaBrazilBrunei DarussalamBulgariaBurkina FasoBurundiCabo VerdeCambodiaCameroonCanadaCentral African RepublicChadChileChinaColombiaComorosCongo, Dem. Rep.Congo, Rep.Costa RicaCote d'IvoireCroatiaCubaCyprusCzech RepublicDenmarkDjiboutiDominicaDominican RepublicEcuadorEgypt, Arab Rep.El SalvadorEquatorial GuineaEritreaEstoniaEthiopiaFaroe IslandsFijiFinlandFranceFrench PolynesiaGabonGambia, TheGeorgiaGermanyGhanaGreeceGrenadaGuatemalaGuineaGuinea-BissauGuyanaHaitiHondurasHong Kong SAR, ChinaHungaryIcelandIndiaIndonesiaIran, Islamic Rep.IraqIrelandIsraelItalyJamaicaJapanJordanKazakhstanKenyaKiribatiKorea, Rep.KosovoKuwaitKyrgyz RepublicLao PDRLatviaLebanonLesothoLiberiaLibyaLithuaniaLuxembourgMacao SAR, ChinaMacedonia, FYRMadagascarMalawiMalaysiaMaldivesMaliMaltaMauritaniaMauritiusMexicoMicronesia, Fed. Sts.MoldovaMongoliaMontenegroMoroccoMozambiqueMyanmarNamibiaNepalNetherlandsNew CaledoniaNew ZealandNicaraguaNigerNigeriaNorwayOmanPakistanPalauPanamaPapua New GuineaParaguayPeruPhilippinesPolandPortugalPuerto RicoQatarRomaniaRussian FederationRwandaSamoaSaudi ArabiaSenegalSerbiaSeychellesSierra LeoneSingaporeSlovak RepublicSloveniaSolomon IslandsSomaliaSouth AfricaSouth SudanSpainSri LankaSt. Kitts and NevisSt. LuciaSt. Vincent and the GrenadinesSudanSurinameSwazilandSwedenSwitzerlandSyrian Arab RepublicTajikistanTanzaniaThailandTimor-LesteTogoTongaTrinidad and TobagoTunisiaTurkeyTurkmenistanUgandaUkraineUnited Arab EmiratesUnited KingdomUnited StatesUruguayUzbekistanVanuatuVenezuela, RBVietnamWest Bank and GazaYemen, Rep.ZambiaZimbabwe Timeline:
This timeline shows a graph from 1996 to 2016 of Serbia. No data until 1995. Number of actual observations by date: 21.
Source name:
World Development Indicators
Source organization:
World Bank national accounts data, and OECD National Accounts data files.
Categories, topics:
Economy & Growth
Last updated:
apr 23, 2017
Indicators value changes by year
Minimum:
8.959 bln
jan 1, 1996
Maximum:
2.282 trl
jan 1, 2016
At the date of observation
Value
Absolute change
Change from previous value
jan 1, 1996
8.959 bln
+8.959 bln
0.0%
jan 1, 1997
30.45 bln
+21.491 bln
239.89%
jan 1, 1998
42.667 bln
+12.217 bln
40.12%
jan 1, 1999
55.701 bln
+13.034 bln
30.55%
jan 1, 2000
39.469 bln
-16.232 bln
-29.14%
jan 1, 2001
59.147 bln
+19.678 bln
49.86%
jan 1, 2002
309.817 bln
+250.67 bln
423.81%
jan 1, 2003
401.929 bln
+92.113 bln
29.73%
jan 1, 2004
482.58 bln
+80.651 bln
20.07%
jan 1, 2005
734.916 bln
+252.336 bln
52.29%
jan 1, 2006
825.582 bln
+90.666 bln
12.34%
jan 1, 2007
1.04 trl
+214.334 bln
25.96%
jan 1, 2008
1.24 trl
+200.34 bln
19.27%
jan 1, 2009
1.486 trl
+245.809 bln
19.82%
jan 1, 2010
1.231 trl
-254.993 bln
-17.16%
jan 1, 2011
1.47 trl
+238.778 bln
19.4%
jan 1, 2012
1.682 trl
+212.582 bln
14.46%
jan 1, 2013
1.921 trl
+238.596 bln
14.18%
jan 1, 2014
2.012 trl
+91.184 bln
4.75%
jan 1, 2015
2.119 trl
+107.074 bln
5.32%
jan 1, 2016
2.282 trl
+162.294 bln
7.66%
Ranking of countries by current statistics by years


Comments: