29
/
en
AIzaSyAYiBZKx7MnpbEhh9jyipgxe19OcubqV5w
April 1, 2024
152650
Hungary
HUN
true
2
1
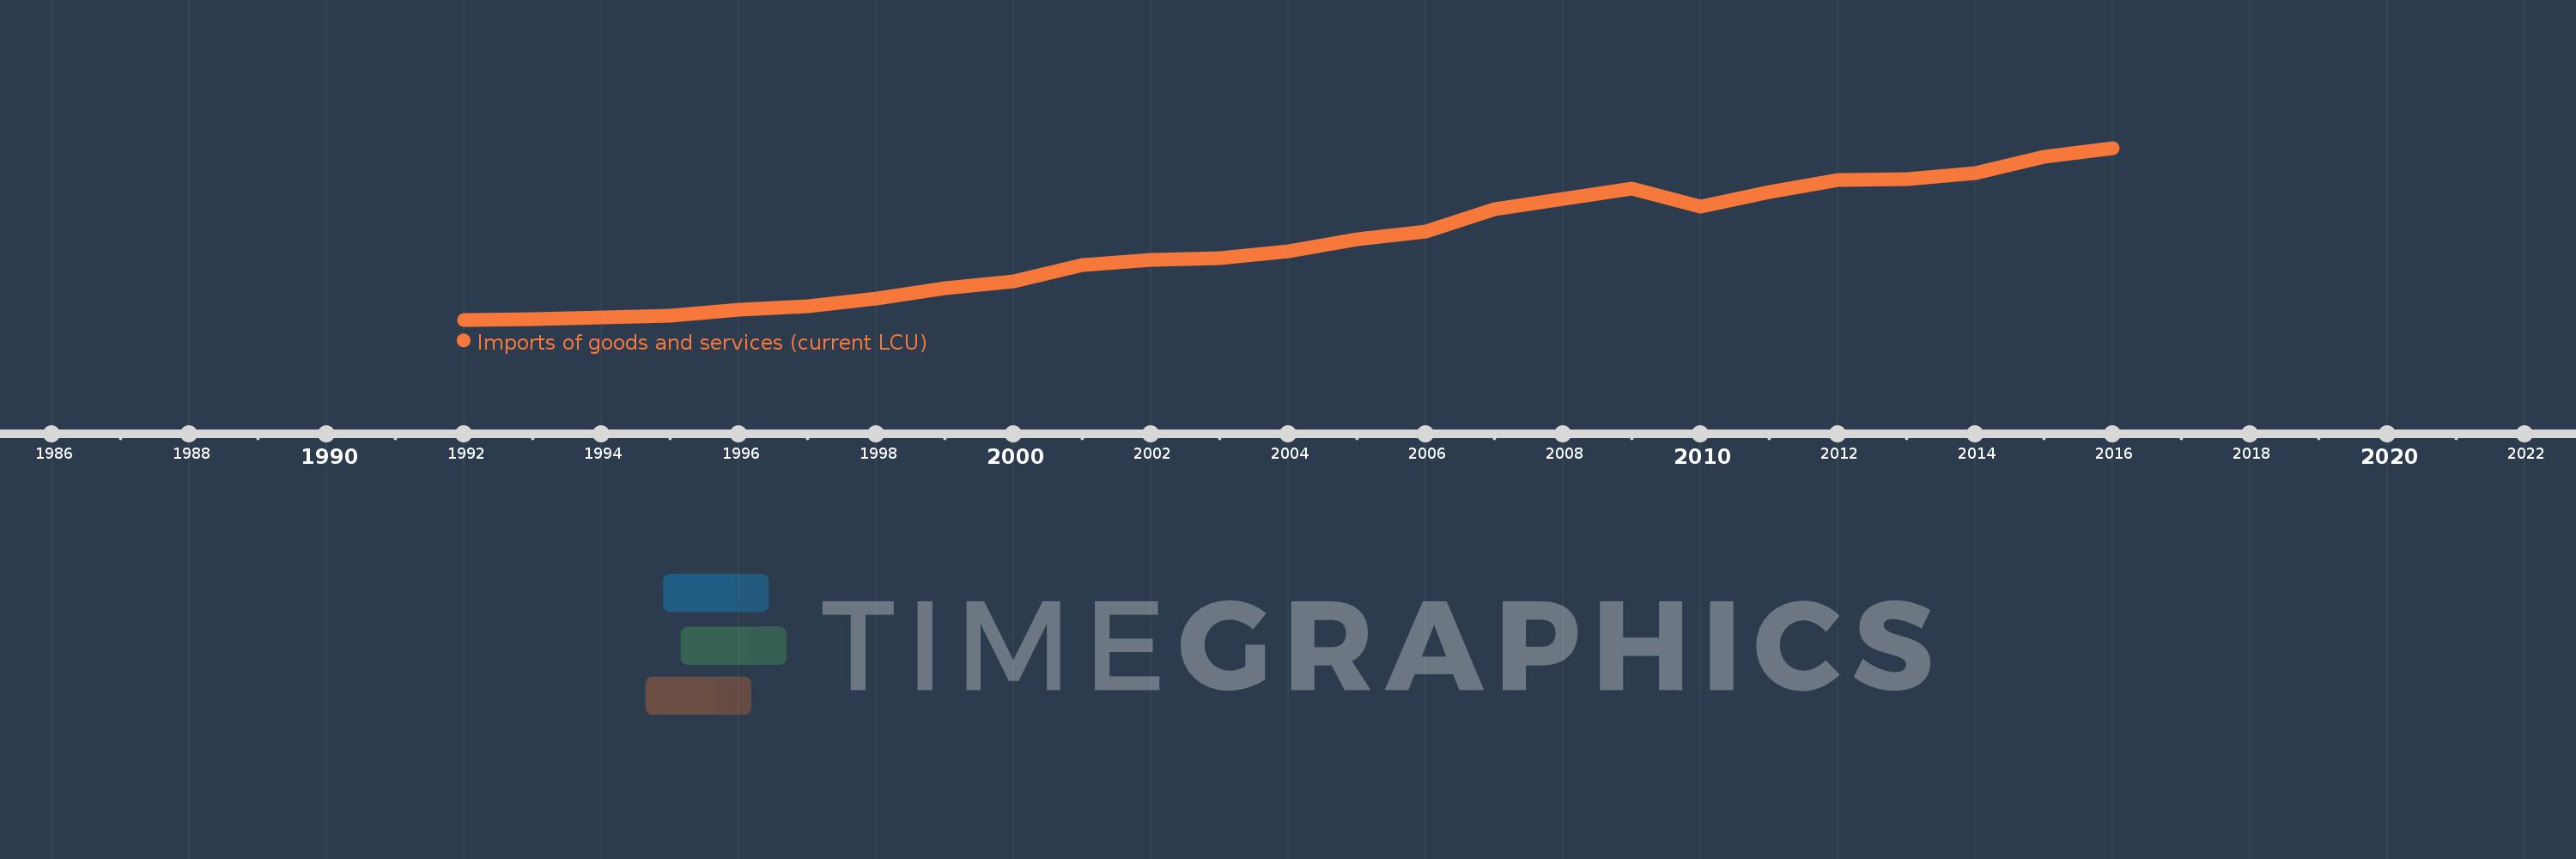
Imports of goods and services (current LCU)
2016,2015,2014,2013,2012,2011,2010,2009,2008,2007,2006,2005,2004,2003,2002,2001,2000,1999,1998,1997,1996,1995,1994,1993,1992
This statistics in other country:
AfghanistanAlbaniaAlgeriaAngolaAntigua and BarbudaArgentinaArmeniaArubaAustraliaAustriaAzerbaijanBahamas, TheBahrainBangladeshBarbadosBelarusBelgiumBelizeBeninBermudaBhutanBoliviaBosnia and HerzegovinaBotswanaBrazilBrunei DarussalamBulgariaBurkina FasoBurundiCabo VerdeCambodiaCameroonCanadaCentral African RepublicChadChileChinaColombiaComorosCongo, Dem. Rep.Congo, Rep.Costa RicaCote d'IvoireCroatiaCubaCyprusCzech RepublicDenmarkDjiboutiDominicaDominican RepublicEcuadorEgypt, Arab Rep.El SalvadorEquatorial GuineaEritreaEstoniaEthiopiaFaroe IslandsFijiFinlandFranceFrench PolynesiaGabonGambia, TheGeorgiaGermanyGhanaGreeceGrenadaGuatemalaGuineaGuinea-BissauGuyanaHaitiHondurasHong Kong SAR, ChinaHungaryIcelandIndiaIndonesiaIran, Islamic Rep.IraqIrelandIsraelItalyJamaicaJapanJordanKazakhstanKenyaKiribatiKorea, Rep.KosovoKuwaitKyrgyz RepublicLao PDRLatviaLebanonLesothoLiberiaLibyaLithuaniaLuxembourgMacao SAR, ChinaMacedonia, FYRMadagascarMalawiMalaysiaMaldivesMaliMaltaMauritaniaMauritiusMexicoMicronesia, Fed. Sts.MoldovaMongoliaMontenegroMoroccoMozambiqueMyanmarNamibiaNepalNetherlandsNew CaledoniaNew ZealandNicaraguaNigerNigeriaNorwayOmanPakistanPalauPanamaPapua New GuineaParaguayPeruPhilippinesPolandPortugalPuerto RicoQatarRomaniaRussian FederationRwandaSamoaSaudi ArabiaSenegalSerbiaSeychellesSierra LeoneSingaporeSlovak RepublicSloveniaSolomon IslandsSomaliaSouth AfricaSouth SudanSpainSri LankaSt. Kitts and NevisSt. LuciaSt. Vincent and the GrenadinesSudanSurinameSwazilandSwedenSwitzerlandSyrian Arab RepublicTajikistanTanzaniaThailandTimor-LesteTogoTongaTrinidad and TobagoTunisiaTurkeyTurkmenistanUgandaUkraineUnited Arab EmiratesUnited KingdomUnited StatesUruguayUzbekistanVanuatuVenezuela, RBVietnamWest Bank and GazaYemen, Rep.ZambiaZimbabwe Timeline:
This timeline shows a graph from 1992 to 2016 of Hungary. No data until 1991. Number of actual observations by date: 25.
Source name:
World Development Indicators
Source organization:
World Bank national accounts data, and OECD National Accounts data files.
Categories, topics:
Economy & Growth
Last updated:
apr 23, 2017
Indicators value changes by year
Minimum:
766.939 bln
jan 1, 1992
Maximum:
27.817 trl
jan 1, 2016
At the date of observation
Value
Absolute change
Change from previous value
jan 1, 1992
766.939 bln
+766.939 bln
0.0%
jan 1, 1993
849.421 bln
+82.481 bln
10.75%
jan 1, 1994
1.118 trl
+268.395 bln
31.6%
jan 1, 1995
1.406 trl
+288.49 bln
25.81%
jan 1, 1996
2.283 trl
+876.349 bln
62.32%
jan 1, 1997
2.944 trl
+661.832 bln
28.99%
jan 1, 1998
4.141 trl
+1.196 trl
40.63%
jan 1, 1999
5.684 trl
+1.544 trl
37.28%
jan 1, 2000
6.787 trl
+1.103 trl
19.41%
jan 1, 2001
9.387 trl
+2.599 trl
38.3%
jan 1, 2002
10.171 trl
+784.105 bln
8.35%
jan 1, 2003
10.473 trl
+302.5 bln
2.97%
jan 1, 2004
11.517 trl
+1.044 trl
9.97%
jan 1, 2005
13.387 trl
+1.87 trl
16.23%
jan 1, 2006
14.62 trl
+1.233 trl
9.21%
jan 1, 2007
18.21 trl
+3.59 trl
24.56%
jan 1, 2008
19.84 trl
+1.63 trl
8.95%
jan 1, 2009
21.461 trl
+1.621 trl
8.17%
jan 1, 2010
18.595 trl
-2.866 trl
-13.35%
jan 1, 2011
20.833 trl
+2.238 trl
12.03%
jan 1, 2012
22.826 trl
+1.993 trl
9.57%
jan 1, 2013
22.944 trl
+118.437 bln
0.52%
jan 1, 2014
23.8 trl
+855.29 bln
3.73%
jan 1, 2015
26.475 trl
+2.676 trl
11.24%
jan 1, 2016
27.817 trl
+1.341 trl
5.07%
Ranking of countries by current statistics by years


Comments: