29
/
en
AIzaSyAYiBZKx7MnpbEhh9jyipgxe19OcubqV5w
April 1, 2024
117009
Cyprus
CYP
true
2
1
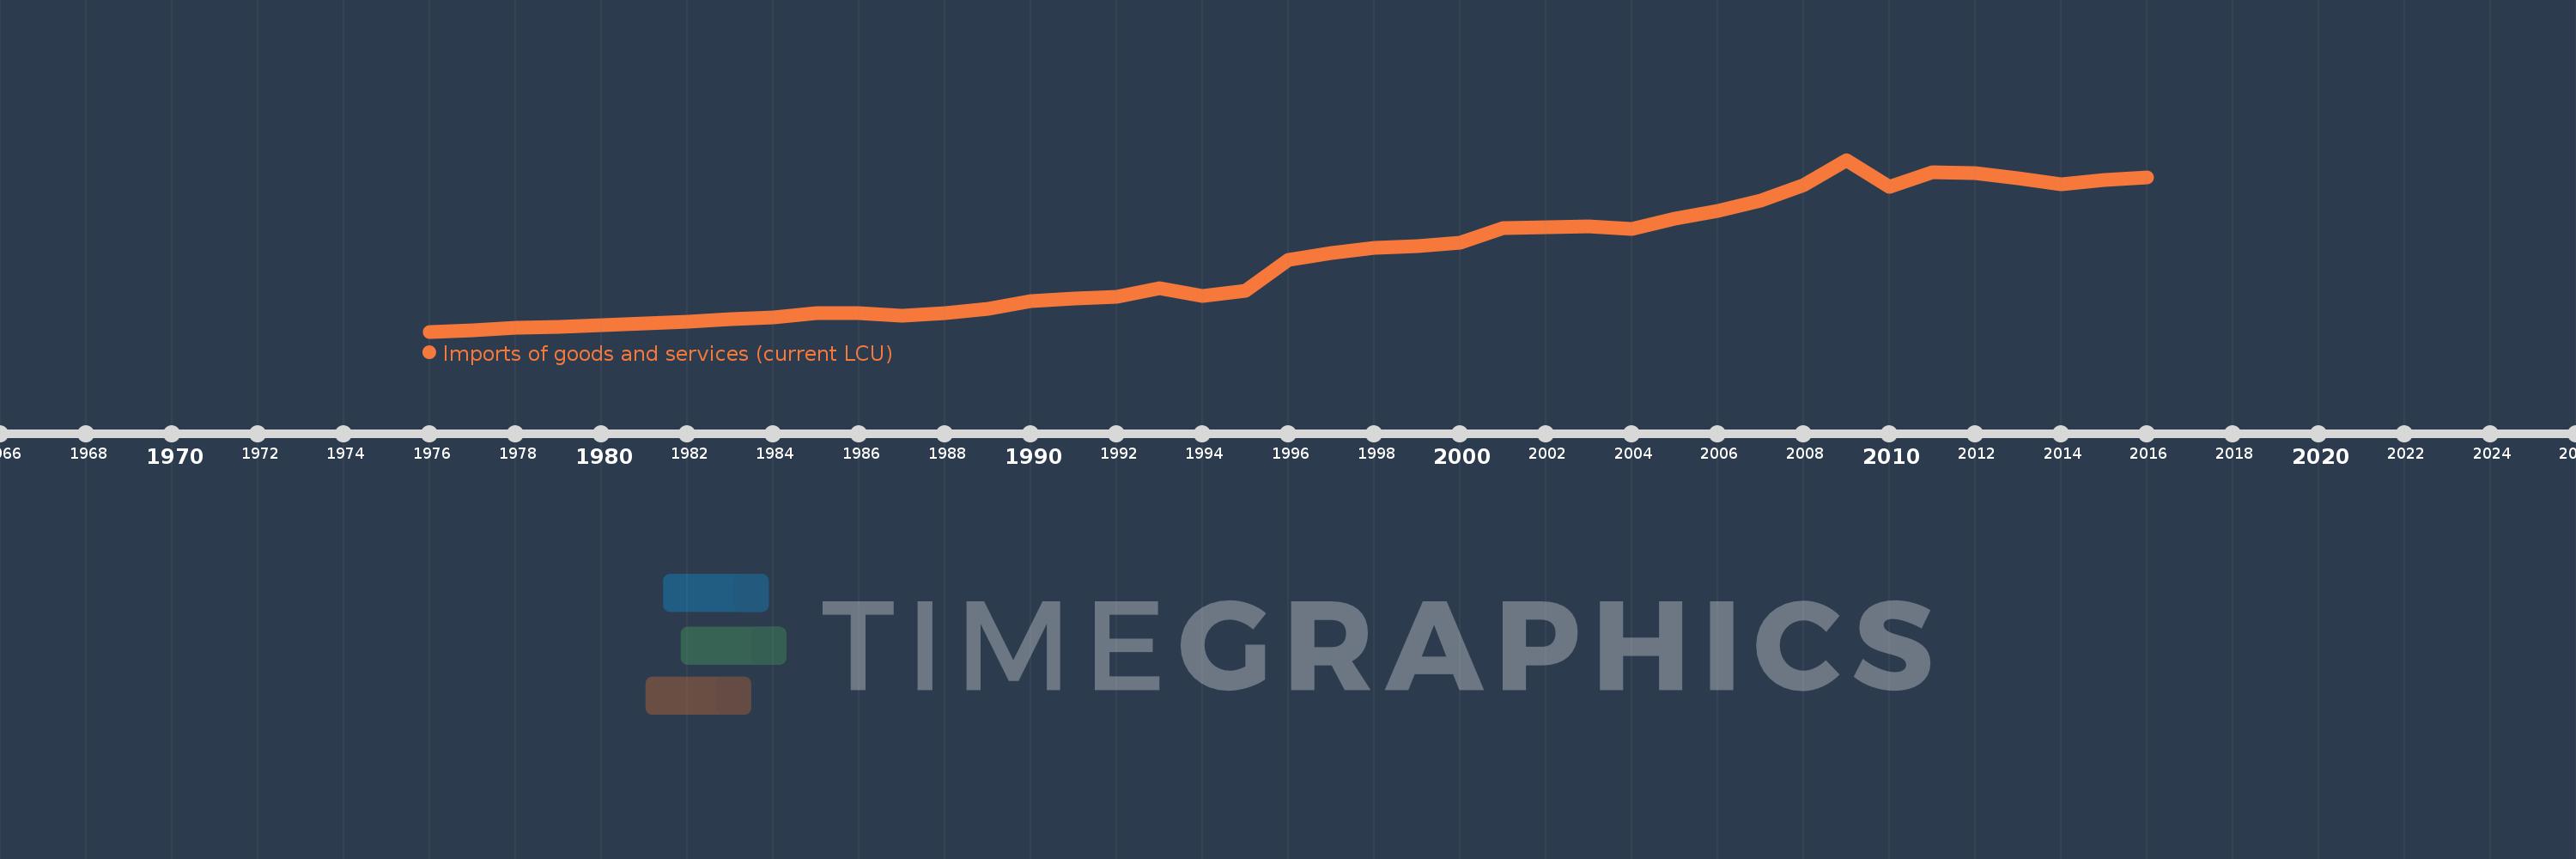
Imports of goods and services (current LCU)
2016,2015,2014,2013,2012,2011,2010,2009,2008,2007,2006,2005,2004,2003,2002,2001,2000,1999,1998,1997,1996,1995,1994,1993,1992,1991,1990,1989,1988,1987,1986,1985,1984,1983,1982,1981,1980,1979,1978,1977,1976
This statistics in other country:
AfghanistanAlbaniaAlgeriaAngolaAntigua and BarbudaArgentinaArmeniaArubaAustraliaAustriaAzerbaijanBahamas, TheBahrainBangladeshBarbadosBelarusBelgiumBelizeBeninBermudaBhutanBoliviaBosnia and HerzegovinaBotswanaBrazilBrunei DarussalamBulgariaBurkina FasoBurundiCabo VerdeCambodiaCameroonCanadaCentral African RepublicChadChileChinaColombiaComorosCongo, Dem. Rep.Congo, Rep.Costa RicaCote d'IvoireCroatiaCubaCyprusCzech RepublicDenmarkDjiboutiDominicaDominican RepublicEcuadorEgypt, Arab Rep.El SalvadorEquatorial GuineaEritreaEstoniaEthiopiaFaroe IslandsFijiFinlandFranceFrench PolynesiaGabonGambia, TheGeorgiaGermanyGhanaGreeceGrenadaGuatemalaGuineaGuinea-BissauGuyanaHaitiHondurasHong Kong SAR, ChinaHungaryIcelandIndiaIndonesiaIran, Islamic Rep.IraqIrelandIsraelItalyJamaicaJapanJordanKazakhstanKenyaKiribatiKorea, Rep.KosovoKuwaitKyrgyz RepublicLao PDRLatviaLebanonLesothoLiberiaLibyaLithuaniaLuxembourgMacao SAR, ChinaMacedonia, FYRMadagascarMalawiMalaysiaMaldivesMaliMaltaMauritaniaMauritiusMexicoMicronesia, Fed. Sts.MoldovaMongoliaMontenegroMoroccoMozambiqueMyanmarNamibiaNepalNetherlandsNew CaledoniaNew ZealandNicaraguaNigerNigeriaNorwayOmanPakistanPalauPanamaPapua New GuineaParaguayPeruPhilippinesPolandPortugalPuerto RicoQatarRomaniaRussian FederationRwandaSamoaSaudi ArabiaSenegalSerbiaSeychellesSierra LeoneSingaporeSlovak RepublicSloveniaSolomon IslandsSomaliaSouth AfricaSouth SudanSpainSri LankaSt. Kitts and NevisSt. LuciaSt. Vincent and the GrenadinesSudanSurinameSwazilandSwedenSwitzerlandSyrian Arab RepublicTajikistanTanzaniaThailandTimor-LesteTogoTongaTrinidad and TobagoTunisiaTurkeyTurkmenistanUgandaUkraineUnited Arab EmiratesUnited KingdomUnited StatesUruguayUzbekistanVanuatuVenezuela, RBVietnamWest Bank and GazaYemen, Rep.ZambiaZimbabwe Timeline:
This timeline shows a graph from 1976 to 2016 of Cyprus. No data until 1975. Number of actual observations by date: 41.
Source name:
World Development Indicators
Source organization:
World Bank national accounts data, and OECD National Accounts data files.
Categories, topics:
Economy & Growth
Last updated:
apr 23, 2017
Indicators value changes by year
Minimum:
248.943 mln
jan 1, 1976
Maximum:
11.946 bln
jan 1, 2009
At the date of observation
Value
Absolute change
Change from previous value
jan 1, 1976
248.943 mln
+248.943 mln
0.0%
jan 1, 1977
357.269 mln
+108.325 mln
43.51%
jan 1, 1978
489.856 mln
+132.587 mln
37.11%
jan 1, 1979
544.531 mln
+54.675 mln
11.16%
jan 1, 1980
686.174 mln
+141.643 mln
26.01%
jan 1, 1981
819.274 mln
+133.1 mln
19.4%
jan 1, 1982
947.761 mln
+128.487 mln
15.68%
jan 1, 1983
1.125 bln
+177.182 mln
18.69%
jan 1, 1984
1.242 bln
+117.552 mln
10.45%
jan 1, 1985
1.533 bln
+290.804 mln
23.4%
jan 1, 1986
1.49 bln
-43.398 mln
-2.83%
jan 1, 1987
1.325 bln
-165.393 mln
-11.1%
jan 1, 1988
1.529 bln
+204.52 mln
15.44%
jan 1, 1989
1.825 bln
+295.588 mln
19.33%
jan 1, 1990
2.309 bln
+484.218 mln
26.54%
jan 1, 1991
2.494 bln
+184.871 mln
8.01%
jan 1, 1992
2.609 bln
+115.501 mln
4.63%
jan 1, 1993
3.215 bln
+605.699 mln
23.21%
jan 1, 1994
2.681 bln
-533.425 mln
-16.59%
jan 1, 1995
2.999 bln
+317.971 mln
11.86%
jan 1, 1996
5.137 bln
+2.137 bln
71.26%
jan 1, 1997
5.574 bln
+436.8 mln
8.5%
jan 1, 1998
5.939 bln
+364.9 mln
6.55%
jan 1, 1999
6.06 bln
+121.5 mln
2.05%
jan 1, 2000
6.325 bln
+265.2 mln
4.38%
jan 1, 2001
7.297 bln
+971.3 mln
15.36%
jan 1, 2002
7.384 bln
+87.5 mln
1.2%
jan 1, 2003
7.399 bln
+15.0 mln
0.2%
jan 1, 2004
7.239 bln
-159.9 mln
-2.16%
jan 1, 2005
7.947 bln
+707.4 mln
9.77%
jan 1, 2006
8.456 bln
+509.2 mln
6.41%
jan 1, 2007
9.168 bln
+712.2 mln
8.42%
jan 1, 2008
10.206 bln
+1.038 bln
11.32%
jan 1, 2009
11.946 bln
+1.741 bln
17.06%
jan 1, 2010
10.098 bln
-1.849 bln
-15.48%
jan 1, 2011
11.093 bln
+995.4 mln
9.86%
jan 1, 2012
11.022 bln
-71.0 mln
-0.64%
jan 1, 2013
10.705 bln
-317.2 mln
-2.88%
jan 1, 2014
10.308 bln
-396.5 mln
-3.7%
jan 1, 2015
10.565 bln
+256.6 mln
2.49%
jan 1, 2016
10.738 bln
+173.2 mln
1.64%
Ranking of countries by current statistics by years


Comments: