29
/
en
AIzaSyAYiBZKx7MnpbEhh9jyipgxe19OcubqV5w
April 1, 2024
203052
Mozambique
MOZ
true
2
1
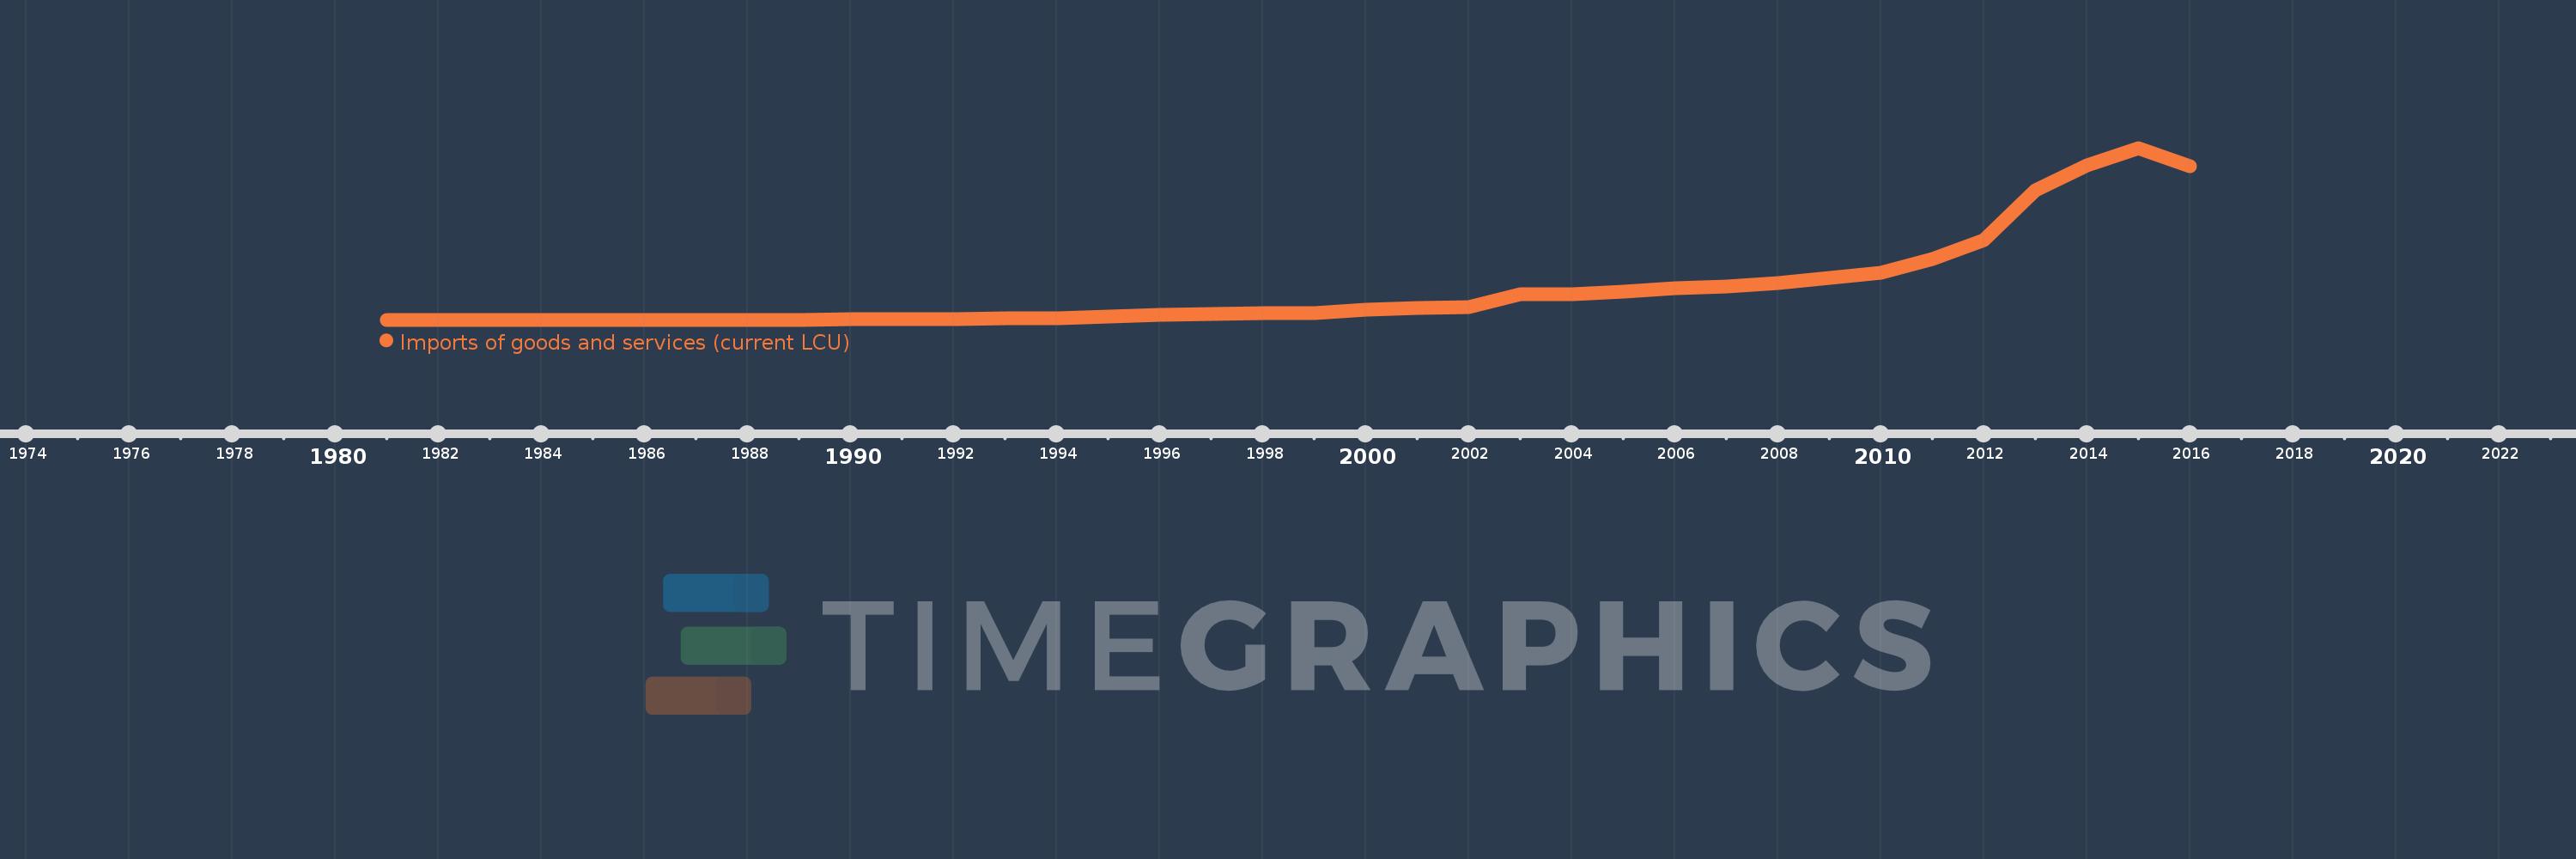
Imports of goods and services (current LCU)
2016,2015,2014,2013,2012,2011,2010,2009,2008,2007,2006,2005,2004,2003,2002,2001,2000,1999,1998,1997,1996,1995,1994,1993,1992,1991,1990,1989,1988,1987,1986,1985,1984,1983,1982,1981
This statistics in other country:
AfghanistanAlbaniaAlgeriaAngolaAntigua and BarbudaArgentinaArmeniaArubaAustraliaAustriaAzerbaijanBahamas, TheBahrainBangladeshBarbadosBelarusBelgiumBelizeBeninBermudaBhutanBoliviaBosnia and HerzegovinaBotswanaBrazilBrunei DarussalamBulgariaBurkina FasoBurundiCabo VerdeCambodiaCameroonCanadaCentral African RepublicChadChileChinaColombiaComorosCongo, Dem. Rep.Congo, Rep.Costa RicaCote d'IvoireCroatiaCubaCyprusCzech RepublicDenmarkDjiboutiDominicaDominican RepublicEcuadorEgypt, Arab Rep.El SalvadorEquatorial GuineaEritreaEstoniaEthiopiaFaroe IslandsFijiFinlandFranceFrench PolynesiaGabonGambia, TheGeorgiaGermanyGhanaGreeceGrenadaGuatemalaGuineaGuinea-BissauGuyanaHaitiHondurasHong Kong SAR, ChinaHungaryIcelandIndiaIndonesiaIran, Islamic Rep.IraqIrelandIsraelItalyJamaicaJapanJordanKazakhstanKenyaKiribatiKorea, Rep.KosovoKuwaitKyrgyz RepublicLao PDRLatviaLebanonLesothoLiberiaLibyaLithuaniaLuxembourgMacao SAR, ChinaMacedonia, FYRMadagascarMalawiMalaysiaMaldivesMaliMaltaMauritaniaMauritiusMexicoMicronesia, Fed. Sts.MoldovaMongoliaMontenegroMoroccoMozambiqueMyanmarNamibiaNepalNetherlandsNew CaledoniaNew ZealandNicaraguaNigerNigeriaNorwayOmanPakistanPalauPanamaPapua New GuineaParaguayPeruPhilippinesPolandPortugalPuerto RicoQatarRomaniaRussian FederationRwandaSamoaSaudi ArabiaSenegalSerbiaSeychellesSierra LeoneSingaporeSlovak RepublicSloveniaSolomon IslandsSomaliaSouth AfricaSouth SudanSpainSri LankaSt. Kitts and NevisSt. LuciaSt. Vincent and the GrenadinesSudanSurinameSwazilandSwedenSwitzerlandSyrian Arab RepublicTajikistanTanzaniaThailandTimor-LesteTogoTongaTrinidad and TobagoTunisiaTurkeyTurkmenistanUgandaUkraineUnited Arab EmiratesUnited KingdomUnited StatesUruguayUzbekistanVanuatuVenezuela, RBVietnamWest Bank and GazaYemen, Rep.ZambiaZimbabwe Timeline:
This timeline shows a graph from 1981 to 2016 of Mozambique. No data until 1980. Number of actual observations by date: 36.
Source name:
World Development Indicators
Source organization:
World Bank national accounts data, and OECD National Accounts data files.
Categories, topics:
Economy & Growth
Last updated:
apr 23, 2017
Indicators value changes by year
Minimum:
22.073 mln
jan 1, 1986
Maximum:
450.752 bln
jan 1, 2015
At the date of observation
Value
Absolute change
Change from previous value
jan 1, 1981
31.259 mln
+31.259 mln
0.0%
jan 1, 1982
32.157 mln
+898.3K
2.87%
jan 1, 1983
35.793 mln
+3.636 mln
11.31%
jan 1, 1984
29.616 mln
-6.177 mln
-17.26%
jan 1, 1985
26.282 mln
-3.334 mln
-11.26%
jan 1, 1986
22.073 mln
-4.209 mln
-16.01%
jan 1, 1987
25.494 mln
+3.421 mln
15.5%
jan 1, 1988
214.781 mln
+189.287 mln
742.47%
jan 1, 1989
409.635 mln
+194.853 mln
90.72%
jan 1, 1990
666.237 mln
+256.602 mln
62.64%
jan 1, 1991
841.821 mln
+175.584 mln
26.35%
jan 1, 1992
2.067 bln
+1.225 bln
145.57%
jan 1, 1993
3.186 bln
+1.119 bln
54.14%
jan 1, 1994
4.754 bln
+1.567 bln
49.18%
jan 1, 1995
7.843 bln
+3.09 bln
65.0%
jan 1, 1996
13.21 bln
+5.367 bln
68.43%
jan 1, 1997
16.136 bln
+2.926 bln
22.15%
jan 1, 1998
16.629 bln
+493.023 mln
3.06%
jan 1, 1999
17.476 bln
+847.518 mln
5.1%
jan 1, 2000
26.771 bln
+9.295 bln
53.18%
jan 1, 2001
30.222 bln
+3.451 bln
12.89%
jan 1, 2002
33.852 bln
+3.63 bln
12.01%
jan 1, 2003
66.723 bln
+32.871 bln
97.1%
jan 1, 2004
67.818 bln
+1.094 bln
1.64%
jan 1, 2005
74.483 bln
+6.665 bln
9.83%
jan 1, 2006
82.251 bln
+7.768 bln
10.43%
jan 1, 2007
86.533 bln
+4.282 bln
5.21%
jan 1, 2008
96.603 bln
+10.07 bln
11.64%
jan 1, 2009
109.424 bln
+12.821 bln
13.27%
jan 1, 2010
123.944 bln
+14.52 bln
13.27%
jan 1, 2011
159.389 bln
+35.445 bln
28.6%
jan 1, 2012
209.578 bln
+50.189 bln
31.49%
jan 1, 2013
339.8 bln
+130.221 bln
62.13%
jan 1, 2014
405.108 bln
+65.308 bln
19.22%
jan 1, 2015
450.752 bln
+45.644 bln
11.27%
jan 1, 2016
402.631 bln
-48.121 bln
-10.68%
Ranking of countries by current statistics by years


Comments: