29
/
en
AIzaSyAYiBZKx7MnpbEhh9jyipgxe19OcubqV5w
April 1, 2024
199273
Mongolia
MNG
true
2
1
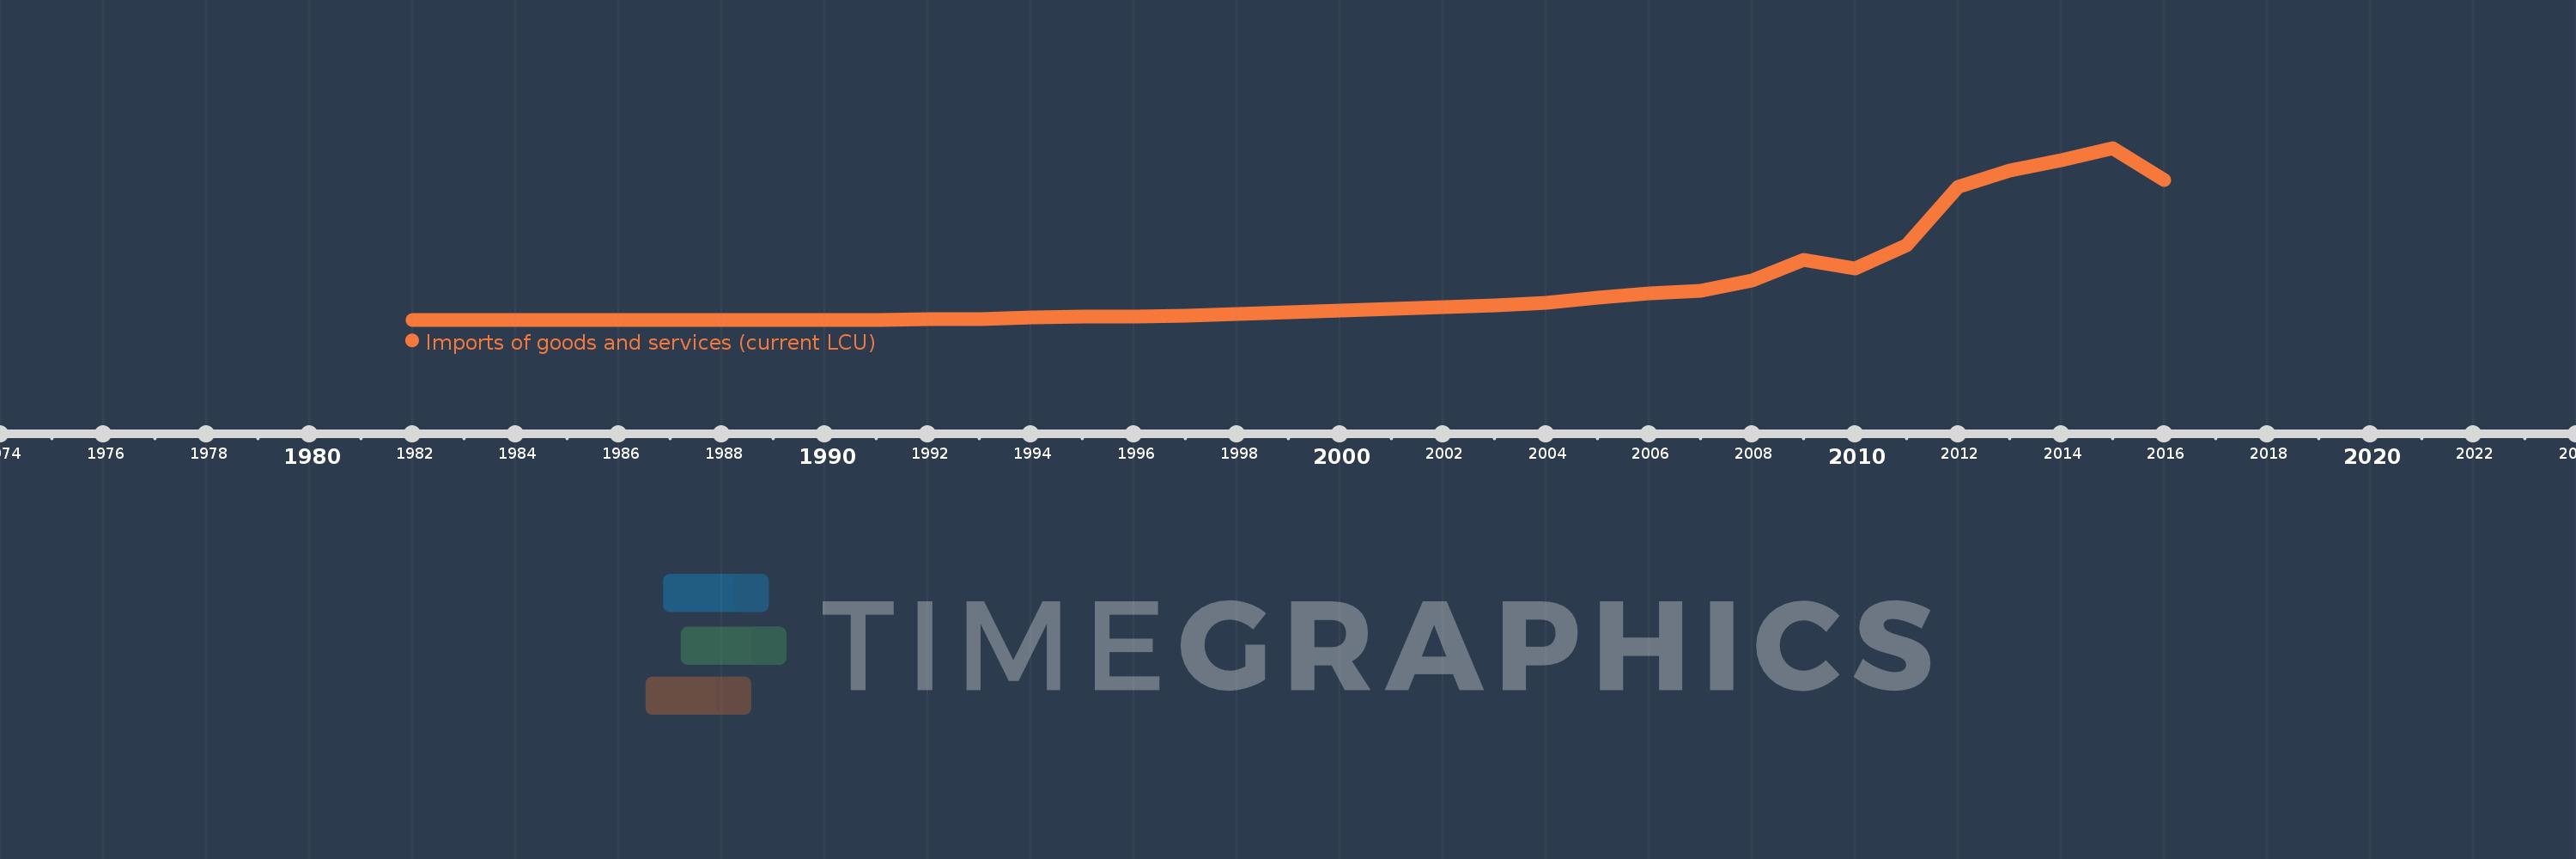
Imports of goods and services (current LCU)
2016,2015,2014,2013,2012,2011,2010,2009,2008,2007,2006,2005,2004,2003,2002,2001,2000,1999,1998,1997,1996,1995,1994,1993,1992,1991,1990,1989,1988,1987,1986,1985,1984,1983,1982
This statistics in other country:
AfghanistanAlbaniaAlgeriaAngolaAntigua and BarbudaArgentinaArmeniaArubaAustraliaAustriaAzerbaijanBahamas, TheBahrainBangladeshBarbadosBelarusBelgiumBelizeBeninBermudaBhutanBoliviaBosnia and HerzegovinaBotswanaBrazilBrunei DarussalamBulgariaBurkina FasoBurundiCabo VerdeCambodiaCameroonCanadaCentral African RepublicChadChileChinaColombiaComorosCongo, Dem. Rep.Congo, Rep.Costa RicaCote d'IvoireCroatiaCubaCyprusCzech RepublicDenmarkDjiboutiDominicaDominican RepublicEcuadorEgypt, Arab Rep.El SalvadorEquatorial GuineaEritreaEstoniaEthiopiaFaroe IslandsFijiFinlandFranceFrench PolynesiaGabonGambia, TheGeorgiaGermanyGhanaGreeceGrenadaGuatemalaGuineaGuinea-BissauGuyanaHaitiHondurasHong Kong SAR, ChinaHungaryIcelandIndiaIndonesiaIran, Islamic Rep.IraqIrelandIsraelItalyJamaicaJapanJordanKazakhstanKenyaKiribatiKorea, Rep.KosovoKuwaitKyrgyz RepublicLao PDRLatviaLebanonLesothoLiberiaLibyaLithuaniaLuxembourgMacao SAR, ChinaMacedonia, FYRMadagascarMalawiMalaysiaMaldivesMaliMaltaMauritaniaMauritiusMexicoMicronesia, Fed. Sts.MoldovaMongoliaMontenegroMoroccoMozambiqueMyanmarNamibiaNepalNetherlandsNew CaledoniaNew ZealandNicaraguaNigerNigeriaNorwayOmanPakistanPalauPanamaPapua New GuineaParaguayPeruPhilippinesPolandPortugalPuerto RicoQatarRomaniaRussian FederationRwandaSamoaSaudi ArabiaSenegalSerbiaSeychellesSierra LeoneSingaporeSlovak RepublicSloveniaSolomon IslandsSomaliaSouth AfricaSouth SudanSpainSri LankaSt. Kitts and NevisSt. LuciaSt. Vincent and the GrenadinesSudanSurinameSwazilandSwedenSwitzerlandSyrian Arab RepublicTajikistanTanzaniaThailandTimor-LesteTogoTongaTrinidad and TobagoTunisiaTurkeyTurkmenistanUgandaUkraineUnited Arab EmiratesUnited KingdomUnited StatesUruguayUzbekistanVanuatuVenezuela, RBVietnamWest Bank and GazaYemen, Rep.ZambiaZimbabwe Timeline:
This timeline shows a graph from 1982 to 2016 of Mongolia. No data until 1981. Number of actual observations by date: 35.
Source name:
World Development Indicators
Source organization:
World Bank national accounts data, and OECD National Accounts data files.
Categories, topics:
Economy & Growth
Last updated:
apr 23, 2017
Indicators value changes by year
Minimum:
4.923 bln
jan 1, 1982
Maximum:
12.686 trl
jan 1, 2015
At the date of observation
Value
Absolute change
Change from previous value
jan 1, 1982
4.923 bln
+4.923 bln
0.0%
jan 1, 1983
4.936 bln
+12.799 mln
0.26%
jan 1, 1984
5.104 bln
+168.71 mln
3.42%
jan 1, 1985
5.463 bln
+358.364 mln
7.02%
jan 1, 1986
5.965 bln
+502.64 mln
9.2%
jan 1, 1987
7.072 bln
+1.107 bln
18.55%
jan 1, 1988
6.548 bln
-523.583 mln
-7.4%
jan 1, 1989
6.347 bln
-201.289 mln
-3.07%
jan 1, 1990
5.782 bln
-565.471 mln
-8.91%
jan 1, 1991
5.166 bln
-615.501 mln
-10.65%
jan 1, 1992
18.654 bln
+13.488 bln
261.08%
jan 1, 1993
20.41 bln
+1.757 bln
9.42%
jan 1, 1994
160.307 bln
+139.897 bln
685.42%
jan 1, 1995
208.348 bln
+48.041 bln
29.97%
jan 1, 1996
270.76 bln
+62.412 bln
29.96%
jan 1, 1997
313.278 bln
+42.518 bln
15.7%
jan 1, 1998
441.508 bln
+128.231 bln
40.93%
jan 1, 1999
562.622 bln
+121.114 bln
27.43%
jan 1, 2000
670.826 bln
+108.203 bln
19.23%
jan 1, 2001
831.014 bln
+160.188 bln
23.88%
jan 1, 2002
911.68 bln
+80.666 bln
9.71%
jan 1, 2003
1.051 trl
+139.488 bln
15.3%
jan 1, 2004
1.243 trl
+191.638 bln
18.23%
jan 1, 2005
1.666 trl
+422.791 bln
34.02%
jan 1, 2006
1.935 trl
+269.105 bln
16.16%
jan 1, 2007
2.154 trl
+219.508 bln
11.35%
jan 1, 2008
2.888 trl
+733.83 bln
34.06%
jan 1, 2009
4.404 trl
+1.516 trl
52.49%
jan 1, 2010
3.792 trl
-612.123 bln
-13.9%
jan 1, 2011
5.529 trl
+1.737 trl
45.81%
jan 1, 2012
9.807 trl
+4.278 trl
77.37%
jan 1, 2013
11.017 trl
+1.21 trl
12.34%
jan 1, 2014
11.777 trl
+760.06 bln
6.9%
jan 1, 2015
12.686 trl
+908.561 bln
7.71%
jan 1, 2016
10.335 trl
-2.351 trl
-18.53%
Ranking of countries by current statistics by years


Comments: