29
/
en
AIzaSyAYiBZKx7MnpbEhh9jyipgxe19OcubqV5w
April 1, 2024
283722
West Bank and Gaza
PSE
true
2
1
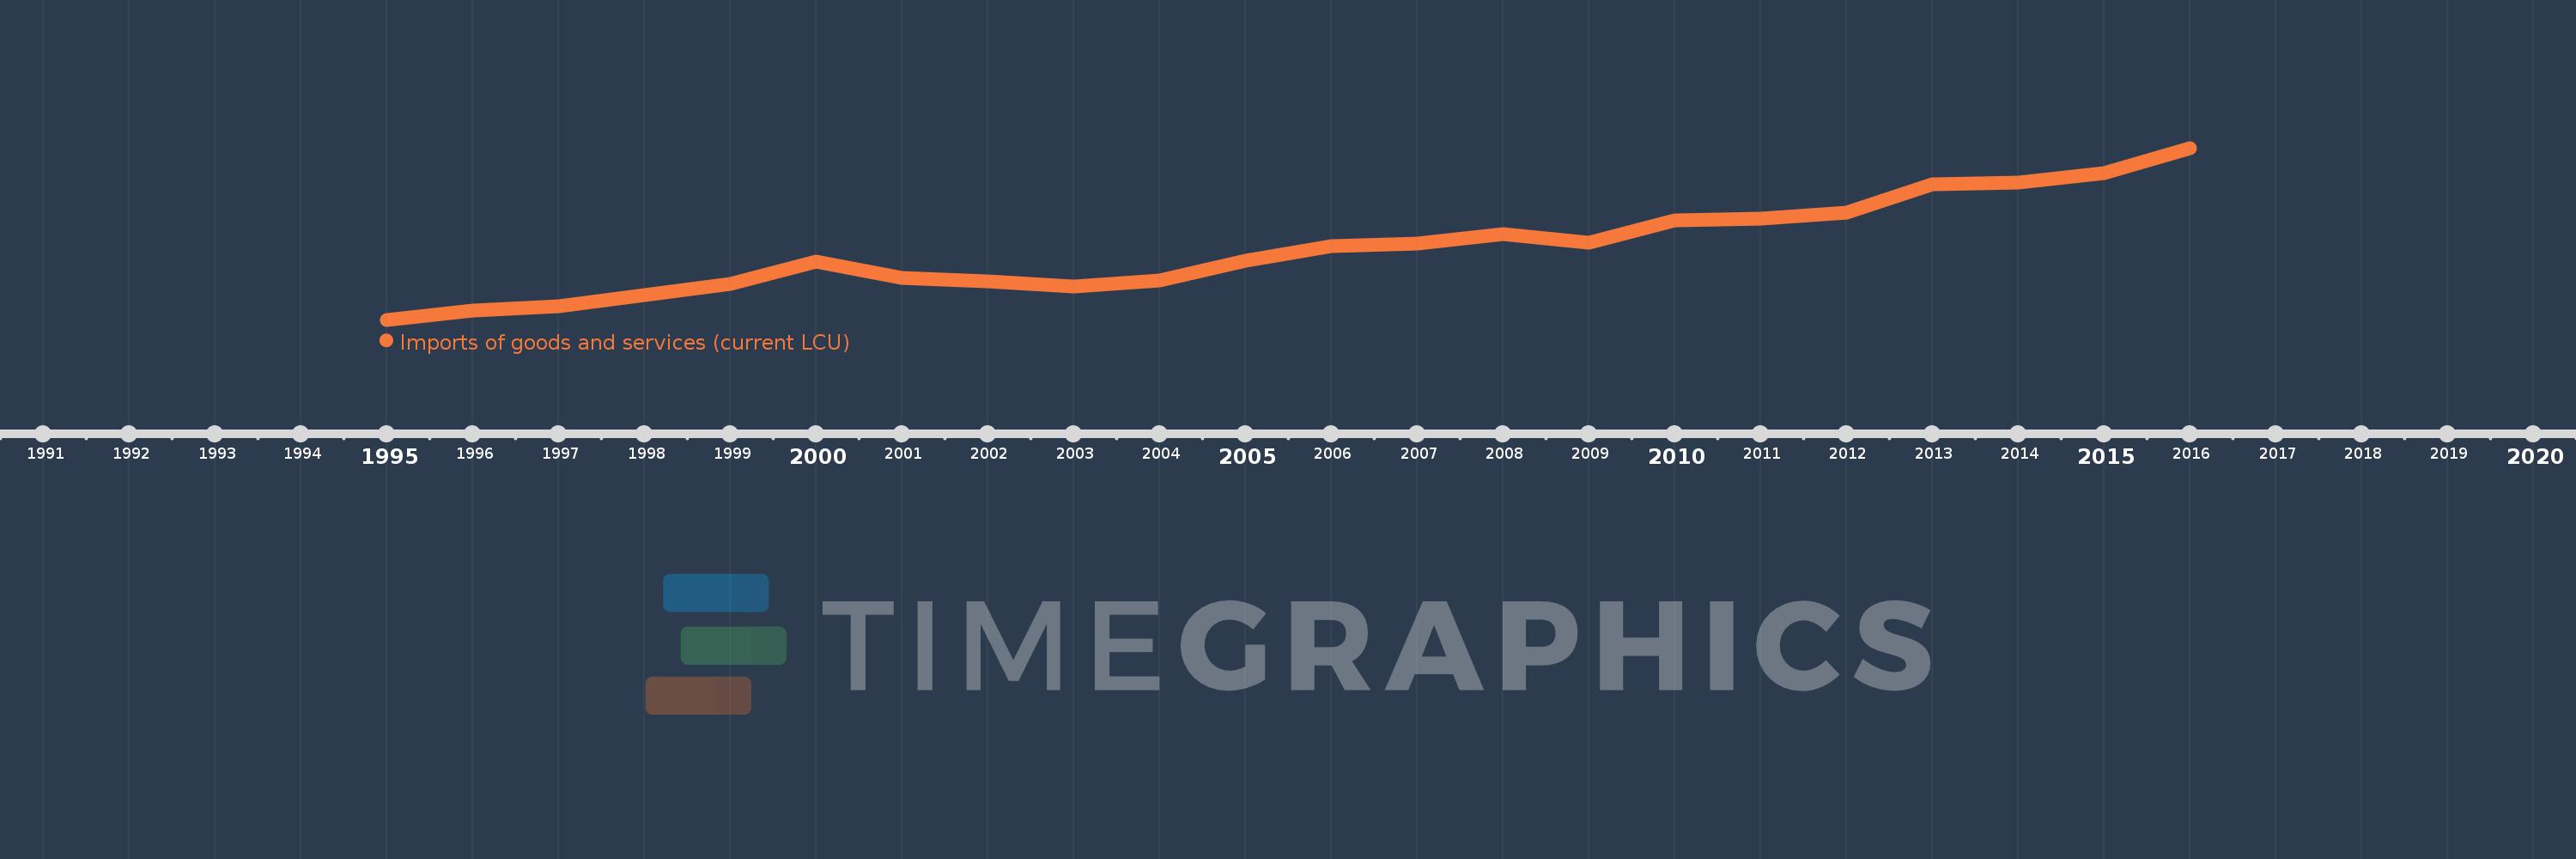
Imports of goods and services (current LCU)
2016,2015,2014,2013,2012,2011,2010,2009,2008,2007,2006,2005,2004,2003,2002,2001,2000,1999,1998,1997,1996,1995
This statistics in other country:
AfghanistanAlbaniaAlgeriaAngolaAntigua and BarbudaArgentinaArmeniaArubaAustraliaAustriaAzerbaijanBahamas, TheBahrainBangladeshBarbadosBelarusBelgiumBelizeBeninBermudaBhutanBoliviaBosnia and HerzegovinaBotswanaBrazilBrunei DarussalamBulgariaBurkina FasoBurundiCabo VerdeCambodiaCameroonCanadaCentral African RepublicChadChileChinaColombiaComorosCongo, Dem. Rep.Congo, Rep.Costa RicaCote d'IvoireCroatiaCubaCyprusCzech RepublicDenmarkDjiboutiDominicaDominican RepublicEcuadorEgypt, Arab Rep.El SalvadorEquatorial GuineaEritreaEstoniaEthiopiaFaroe IslandsFijiFinlandFranceFrench PolynesiaGabonGambia, TheGeorgiaGermanyGhanaGreeceGrenadaGuatemalaGuineaGuinea-BissauGuyanaHaitiHondurasHong Kong SAR, ChinaHungaryIcelandIndiaIndonesiaIran, Islamic Rep.IraqIrelandIsraelItalyJamaicaJapanJordanKazakhstanKenyaKiribatiKorea, Rep.KosovoKuwaitKyrgyz RepublicLao PDRLatviaLebanonLesothoLiberiaLibyaLithuaniaLuxembourgMacao SAR, ChinaMacedonia, FYRMadagascarMalawiMalaysiaMaldivesMaliMaltaMauritaniaMauritiusMexicoMicronesia, Fed. Sts.MoldovaMongoliaMontenegroMoroccoMozambiqueMyanmarNamibiaNepalNetherlandsNew CaledoniaNew ZealandNicaraguaNigerNigeriaNorwayOmanPakistanPalauPanamaPapua New GuineaParaguayPeruPhilippinesPolandPortugalPuerto RicoQatarRomaniaRussian FederationRwandaSamoaSaudi ArabiaSenegalSerbiaSeychellesSierra LeoneSingaporeSlovak RepublicSloveniaSolomon IslandsSomaliaSouth AfricaSouth SudanSpainSri LankaSt. Kitts and NevisSt. LuciaSt. Vincent and the GrenadinesSudanSurinameSwazilandSwedenSwitzerlandSyrian Arab RepublicTajikistanTanzaniaThailandTimor-LesteTogoTongaTrinidad and TobagoTunisiaTurkeyTurkmenistanUgandaUkraineUnited Arab EmiratesUnited KingdomUnited StatesUruguayUzbekistanVanuatuVenezuela, RBVietnamWest Bank and GazaYemen, Rep.ZambiaZimbabwe Timeline:
This timeline shows a graph from 1995 to 2016 of West Bank and Gaza. No data until 1994. Number of actual observations by date: 22.
Source name:
World Development Indicators
Source organization:
World Bank national accounts data, and OECD National Accounts data files.
Categories, topics:
Economy & Growth
Last updated:
apr 23, 2017
Indicators value changes by year
Minimum:
6.157 bln
jan 1, 1995
Maximum:
29.156 bln
jan 1, 2016
At the date of observation
Value
Absolute change
Change from previous value
jan 1, 1995
6.157 bln
+6.157 bln
0.0%
jan 1, 1996
7.351 bln
+1.194 bln
19.4%
jan 1, 1997
7.972 bln
+620.723 mln
8.44%
jan 1, 1998
9.474 bln
+1.502 bln
18.84%
jan 1, 1999
10.966 bln
+1.492 bln
15.75%
jan 1, 2000
13.924 bln
+2.958 bln
26.98%
jan 1, 2001
11.805 bln
-2.118 bln
-15.21%
jan 1, 2002
11.339 bln
-466.006 mln
-3.95%
jan 1, 2003
10.582 bln
-757.058 mln
-6.68%
jan 1, 2004
11.45 bln
+867.27 mln
8.2%
jan 1, 2005
14.062 bln
+2.612 bln
22.81%
jan 1, 2006
16.039 bln
+1.977 bln
14.06%
jan 1, 2007
16.412 bln
+373.903 mln
2.33%
jan 1, 2008
17.6 bln
+1.187 bln
7.23%
jan 1, 2009
16.444 bln
-1.155 bln
-6.56%
jan 1, 2010
19.476 bln
+3.032 bln
18.44%
jan 1, 2011
19.636 bln
+159.631 mln
0.82%
jan 1, 2012
20.478 bln
+842.343 mln
4.29%
jan 1, 2013
24.292 bln
+3.814 bln
18.62%
jan 1, 2014
24.568 bln
+276.099 mln
1.14%
jan 1, 2015
25.793 bln
+1.225 bln
4.99%
jan 1, 2016
29.156 bln
+3.364 bln
13.04%
Ranking of countries by current statistics by years


Comments: