29
/
en
AIzaSyAYiBZKx7MnpbEhh9jyipgxe19OcubqV5w
April 1, 2024
189111
Maldives
MDV
true
2
1
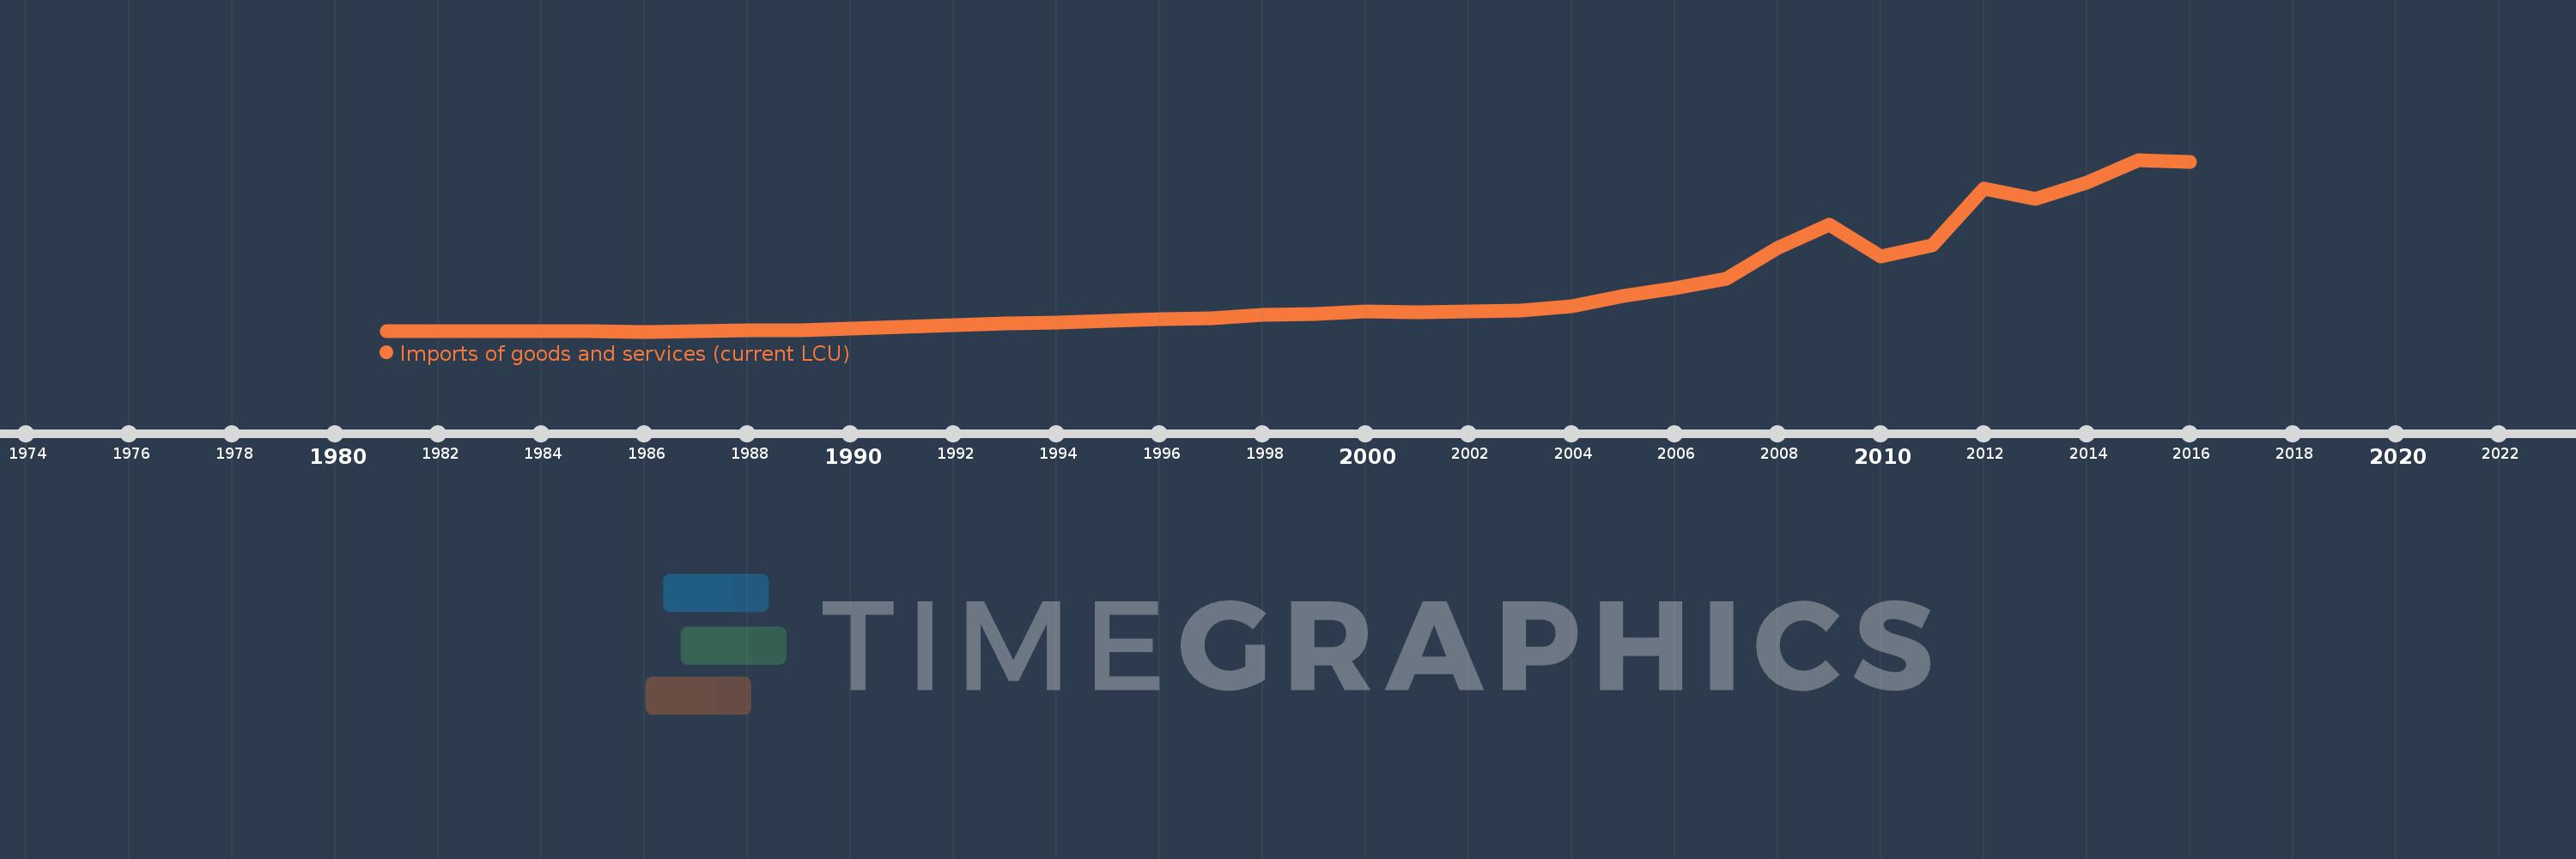
Imports of goods and services (current LCU)
2016,2015,2014,2013,2012,2011,2010,2009,2008,2007,2006,2005,2004,2003,2002,2001,2000,1999,1998,1997,1996,1995,1994,1993,1992,1991,1990,1989,1988,1987,1986,1985,1984,1983,1982,1981
This statistics in other country:
AfghanistanAlbaniaAlgeriaAngolaAntigua and BarbudaArgentinaArmeniaArubaAustraliaAustriaAzerbaijanBahamas, TheBahrainBangladeshBarbadosBelarusBelgiumBelizeBeninBermudaBhutanBoliviaBosnia and HerzegovinaBotswanaBrazilBrunei DarussalamBulgariaBurkina FasoBurundiCabo VerdeCambodiaCameroonCanadaCentral African RepublicChadChileChinaColombiaComorosCongo, Dem. Rep.Congo, Rep.Costa RicaCote d'IvoireCroatiaCubaCyprusCzech RepublicDenmarkDjiboutiDominicaDominican RepublicEcuadorEgypt, Arab Rep.El SalvadorEquatorial GuineaEritreaEstoniaEthiopiaFaroe IslandsFijiFinlandFranceFrench PolynesiaGabonGambia, TheGeorgiaGermanyGhanaGreeceGrenadaGuatemalaGuineaGuinea-BissauGuyanaHaitiHondurasHong Kong SAR, ChinaHungaryIcelandIndiaIndonesiaIran, Islamic Rep.IraqIrelandIsraelItalyJamaicaJapanJordanKazakhstanKenyaKiribatiKorea, Rep.KosovoKuwaitKyrgyz RepublicLao PDRLatviaLebanonLesothoLiberiaLibyaLithuaniaLuxembourgMacao SAR, ChinaMacedonia, FYRMadagascarMalawiMalaysiaMaldivesMaliMaltaMauritaniaMauritiusMexicoMicronesia, Fed. Sts.MoldovaMongoliaMontenegroMoroccoMozambiqueMyanmarNamibiaNepalNetherlandsNew CaledoniaNew ZealandNicaraguaNigerNigeriaNorwayOmanPakistanPalauPanamaPapua New GuineaParaguayPeruPhilippinesPolandPortugalPuerto RicoQatarRomaniaRussian FederationRwandaSamoaSaudi ArabiaSenegalSerbiaSeychellesSierra LeoneSingaporeSlovak RepublicSloveniaSolomon IslandsSomaliaSouth AfricaSouth SudanSpainSri LankaSt. Kitts and NevisSt. LuciaSt. Vincent and the GrenadinesSudanSurinameSwazilandSwedenSwitzerlandSyrian Arab RepublicTajikistanTanzaniaThailandTimor-LesteTogoTongaTrinidad and TobagoTunisiaTurkeyTurkmenistanUgandaUkraineUnited Arab EmiratesUnited KingdomUnited StatesUruguayUzbekistanVanuatuVenezuela, RBVietnamWest Bank and GazaYemen, Rep.ZambiaZimbabwe Timeline:
This timeline shows a graph from 1981 to 2016 of Maldives. No data until 1980. Number of actual observations by date: 36.
Source name:
World Development Indicators
Source organization:
World Bank national accounts data, and OECD National Accounts data files.
Categories, topics:
Economy & Growth
Last updated:
apr 23, 2017
Indicators value changes by year
Minimum:
603.5 mln
jan 1, 1986
Maximum:
42.465 bln
jan 1, 2015
At the date of observation
Value
Absolute change
Change from previous value
jan 1, 1981
657.605 mln
+657.605 mln
0.0%
jan 1, 1982
706.68 mln
+49.075 mln
7.46%
jan 1, 1983
671.829 mln
-34.851 mln
-4.93%
jan 1, 1984
680.325 mln
+8.496 mln
1.26%
jan 1, 1985
671.16 mln
-9.165 mln
-1.35%
jan 1, 1986
603.5 mln
-67.66 mln
-10.08%
jan 1, 1987
616.33 mln
+12.83 mln
2.13%
jan 1, 1988
874.978 mln
+258.648 mln
41.97%
jan 1, 1989
1.017 bln
+141.746 mln
16.2%
jan 1, 1990
1.267 bln
+250.684 mln
24.66%
jan 1, 1991
1.697 bln
+429.826 mln
33.91%
jan 1, 1992
2.076 bln
+379.111 mln
22.34%
jan 1, 1993
2.508 bln
+431.916 mln
20.8%
jan 1, 1994
2.816 bln
+308.196 mln
12.29%
jan 1, 1995
3.267 bln
+450.728 mln
16.0%
jan 1, 1996
3.625 bln
+358.114 mln
10.96%
jan 1, 1997
3.875 bln
+249.5 mln
6.88%
jan 1, 1998
4.693 bln
+818.239 mln
21.12%
jan 1, 1999
4.817 bln
+124.307 mln
2.65%
jan 1, 2000
5.543 bln
+725.768 mln
15.07%
jan 1, 2001
5.263 bln
-280.28 mln
-5.06%
jan 1, 2002
5.582 bln
+319.285 mln
6.07%
jan 1, 2003
5.835 bln
+252.881 mln
4.53%
jan 1, 2004
6.842 bln
+1.007 bln
17.26%
jan 1, 2005
9.245 bln
+2.403 bln
35.12%
jan 1, 2006
11.117 bln
+1.872 bln
20.25%
jan 1, 2007
13.395 bln
+2.278 bln
20.49%
jan 1, 2008
20.937 bln
+7.542 bln
56.3%
jan 1, 2009
26.585 bln
+5.648 bln
26.98%
jan 1, 2010
18.944 bln
-7.641 bln
-28.74%
jan 1, 2011
21.673 bln
+2.729 bln
14.4%
jan 1, 2012
35.41 bln
+13.737 bln
63.38%
jan 1, 2013
32.991 bln
-2.419 bln
-6.83%
jan 1, 2014
36.953 bln
+3.962 bln
12.01%
jan 1, 2015
42.465 bln
+5.512 bln
14.92%
jan 1, 2016
41.973 bln
-491.268 mln
-1.16%
Ranking of countries by current statistics by years


Comments: