29
/
en
AIzaSyAYiBZKx7MnpbEhh9jyipgxe19OcubqV5w
April 1, 2024
205390
Namibia
NAM
true
2
1
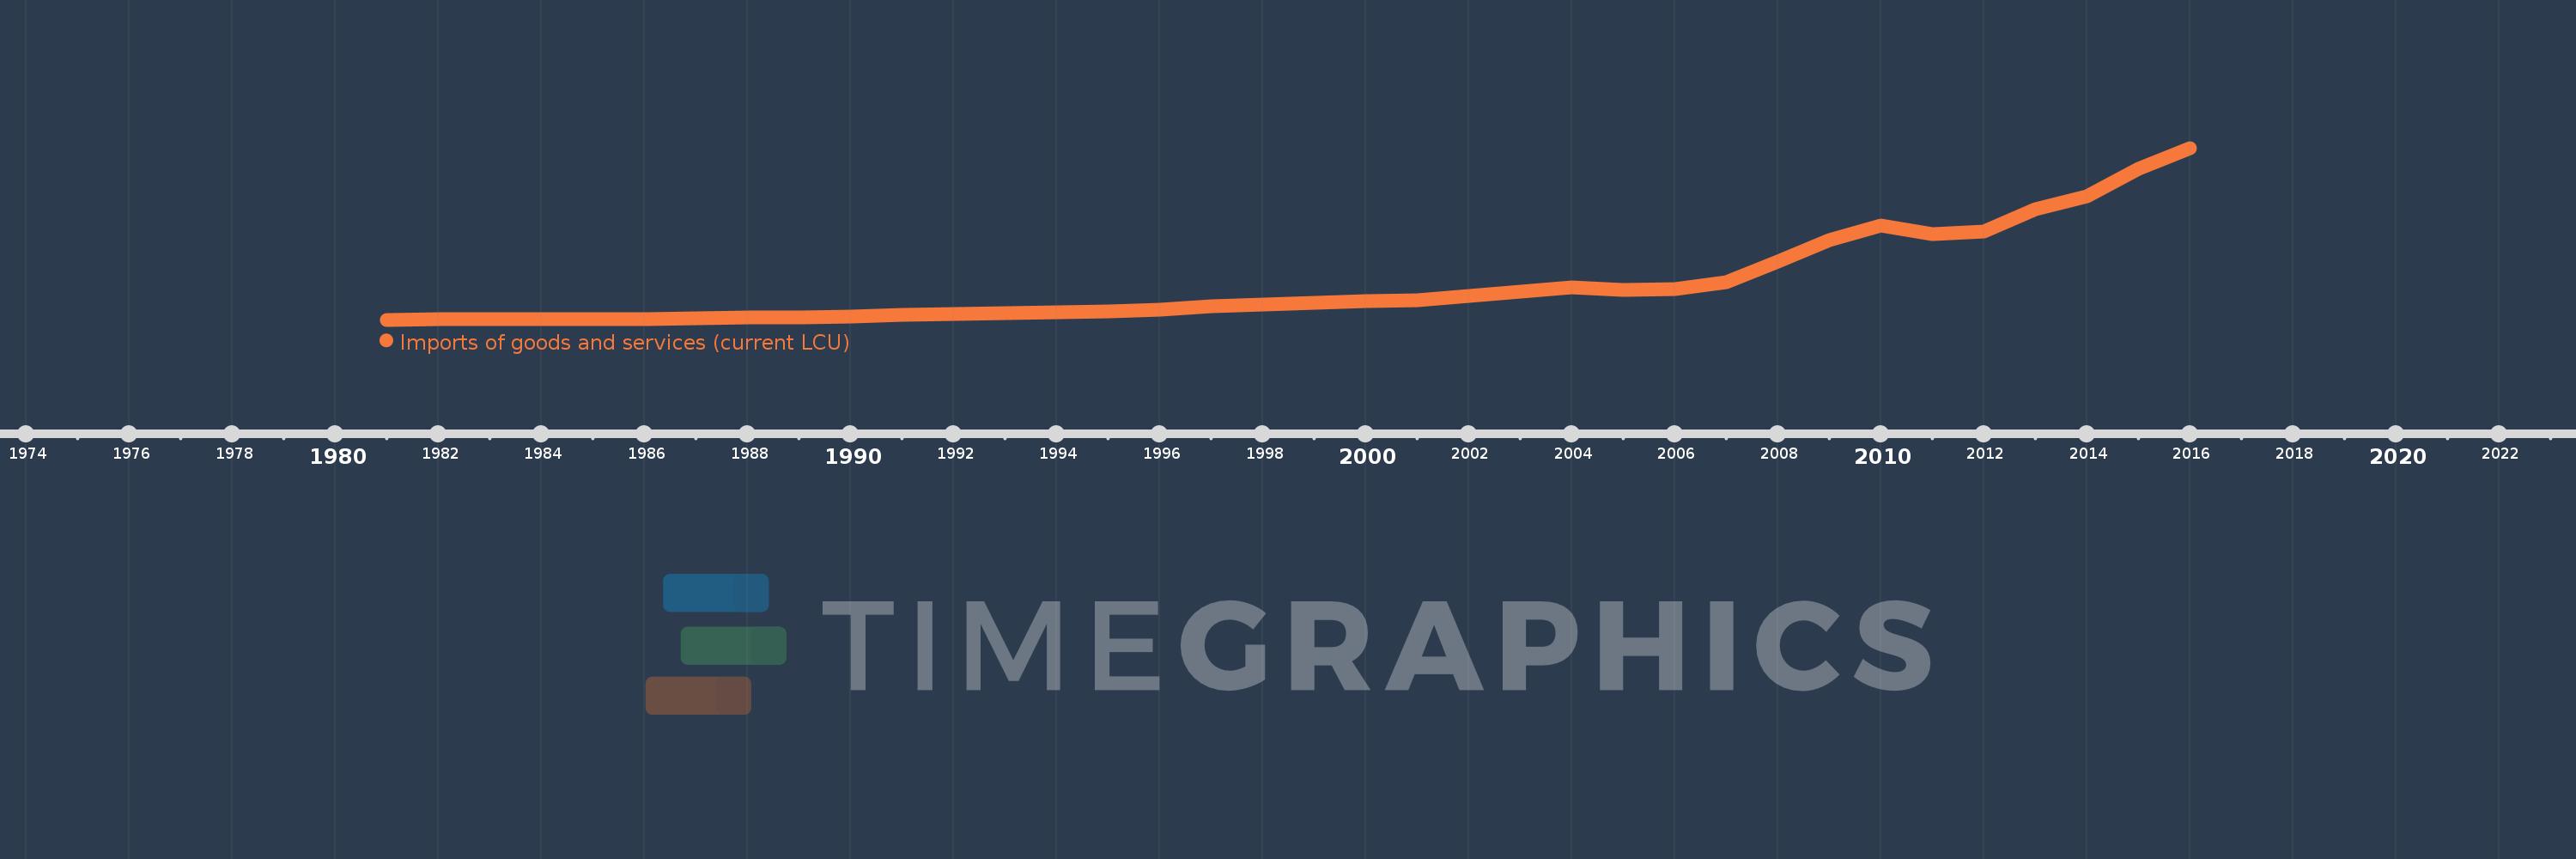
Imports of goods and services (current LCU)
2016,2015,2014,2013,2012,2011,2010,2009,2008,2007,2006,2005,2004,2003,2002,2001,2000,1999,1998,1997,1996,1995,1994,1993,1992,1991,1990,1989,1988,1987,1986,1985,1984,1983,1982,1981
This statistics in other country:
AfghanistanAlbaniaAlgeriaAngolaAntigua and BarbudaArgentinaArmeniaArubaAustraliaAustriaAzerbaijanBahamas, TheBahrainBangladeshBarbadosBelarusBelgiumBelizeBeninBermudaBhutanBoliviaBosnia and HerzegovinaBotswanaBrazilBrunei DarussalamBulgariaBurkina FasoBurundiCabo VerdeCambodiaCameroonCanadaCentral African RepublicChadChileChinaColombiaComorosCongo, Dem. Rep.Congo, Rep.Costa RicaCote d'IvoireCroatiaCubaCyprusCzech RepublicDenmarkDjiboutiDominicaDominican RepublicEcuadorEgypt, Arab Rep.El SalvadorEquatorial GuineaEritreaEstoniaEthiopiaFaroe IslandsFijiFinlandFranceFrench PolynesiaGabonGambia, TheGeorgiaGermanyGhanaGreeceGrenadaGuatemalaGuineaGuinea-BissauGuyanaHaitiHondurasHong Kong SAR, ChinaHungaryIcelandIndiaIndonesiaIran, Islamic Rep.IraqIrelandIsraelItalyJamaicaJapanJordanKazakhstanKenyaKiribatiKorea, Rep.KosovoKuwaitKyrgyz RepublicLao PDRLatviaLebanonLesothoLiberiaLibyaLithuaniaLuxembourgMacao SAR, ChinaMacedonia, FYRMadagascarMalawiMalaysiaMaldivesMaliMaltaMauritaniaMauritiusMexicoMicronesia, Fed. Sts.MoldovaMongoliaMontenegroMoroccoMozambiqueMyanmarNamibiaNepalNetherlandsNew CaledoniaNew ZealandNicaraguaNigerNigeriaNorwayOmanPakistanPalauPanamaPapua New GuineaParaguayPeruPhilippinesPolandPortugalPuerto RicoQatarRomaniaRussian FederationRwandaSamoaSaudi ArabiaSenegalSerbiaSeychellesSierra LeoneSingaporeSlovak RepublicSloveniaSolomon IslandsSomaliaSouth AfricaSouth SudanSpainSri LankaSt. Kitts and NevisSt. LuciaSt. Vincent and the GrenadinesSudanSurinameSwazilandSwedenSwitzerlandSyrian Arab RepublicTajikistanTanzaniaThailandTimor-LesteTogoTongaTrinidad and TobagoTunisiaTurkeyTurkmenistanUgandaUkraineUnited Arab EmiratesUnited KingdomUnited StatesUruguayUzbekistanVanuatuVenezuela, RBVietnamWest Bank and GazaYemen, Rep.ZambiaZimbabwe Timeline:
This timeline shows a graph from 1981 to 2016 of Namibia. No data until 1980. Number of actual observations by date: 36.
Source name:
World Development Indicators
Source organization:
World Bank national accounts data, and OECD National Accounts data files.
Categories, topics:
Economy & Growth
Last updated:
apr 23, 2017
Indicators value changes by year
Minimum:
1.062 bln
jan 1, 1981
Maximum:
99.587 bln
jan 1, 2016
At the date of observation
Value
Absolute change
Change from previous value
jan 1, 1981
1.062 bln
+1.062 bln
0.0%
jan 1, 1982
1.338 bln
+276.94 mln
26.09%
jan 1, 1983
1.402 bln
+63.202 mln
4.72%
jan 1, 1984
1.348 bln
-54.009 mln
-3.85%
jan 1, 1985
1.484 bln
+136.127 mln
10.1%
jan 1, 1986
1.438 bln
-45.965 mln
-3.1%
jan 1, 1987
1.909 bln
+471.584 mln
32.8%
jan 1, 1988
2.406 bln
+496.6 mln
26.01%
jan 1, 1989
2.539 bln
+132.68 mln
5.51%
jan 1, 1990
3.092 bln
+553.703 mln
21.81%
jan 1, 1991
3.624 bln
+531.168 mln
17.18%
jan 1, 1992
4.127 bln
+503.135 mln
13.89%
jan 1, 1993
4.789 bln
+661.964 mln
16.04%
jan 1, 1994
5.258 bln
+469.39 mln
9.8%
jan 1, 1995
5.909 bln
+651.034 mln
12.38%
jan 1, 1996
7.052 bln
+1.143 bln
19.35%
jan 1, 1997
8.771 bln
+1.718 bln
24.37%
jan 1, 1998
9.61 bln
+839.524 mln
9.57%
jan 1, 1999
10.869 bln
+1.258 bln
13.09%
jan 1, 2000
11.739 bln
+870.72 mln
8.01%
jan 1, 2001
12.084 bln
+345.054 mln
2.94%
jan 1, 2002
14.556 bln
+2.471 bln
20.45%
jan 1, 2003
17.032 bln
+2.476 bln
17.01%
jan 1, 2004
19.574 bln
+2.542 bln
14.92%
jan 1, 2005
17.959 bln
-1.615 bln
-8.25%
jan 1, 2006
18.615 bln
+656.426 mln
3.66%
jan 1, 2007
22.454 bln
+3.839 bln
20.62%
jan 1, 2008
34.374 bln
+11.92 bln
53.09%
jan 1, 2009
46.871 bln
+12.497 bln
36.36%
jan 1, 2010
55.005 bln
+8.134 bln
17.35%
jan 1, 2011
50.102 bln
-4.903 bln
-8.91%
jan 1, 2012
51.789 bln
+1.688 bln
3.37%
jan 1, 2013
64.284 bln
+12.495 bln
24.13%
jan 1, 2014
71.803 bln
+7.519 bln
11.7%
jan 1, 2015
87.444 bln
+15.642 bln
21.78%
jan 1, 2016
99.587 bln
+12.143 bln
13.89%
Ranking of countries by current statistics by years


Comments: