29
/
en
AIzaSyAYiBZKx7MnpbEhh9jyipgxe19OcubqV5w
April 1, 2024
108637
Comoros
COM
true
2
1
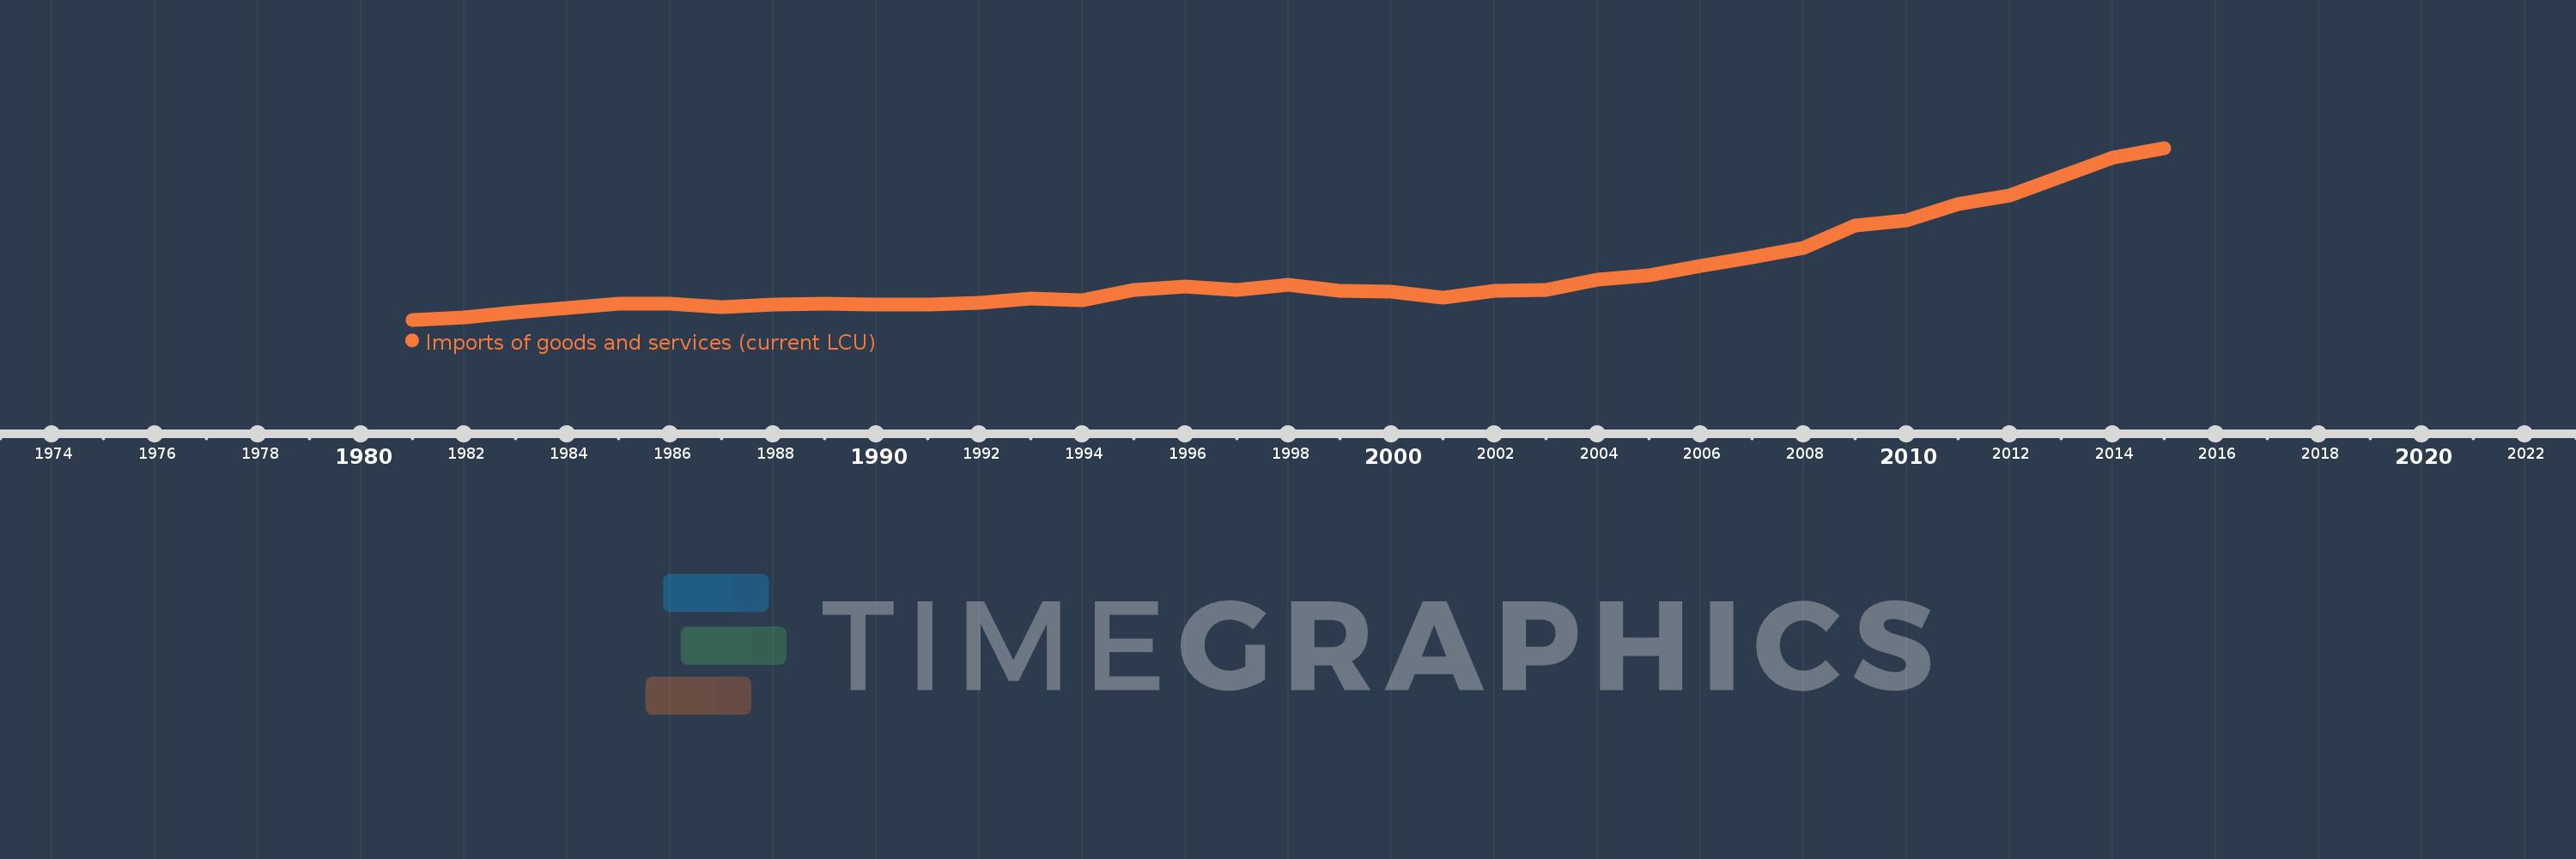
Imports of goods and services (current LCU)
2015,2014,2013,2012,2011,2010,2009,2008,2007,2006,2005,2004,2003,2002,2001,2000,1999,1998,1997,1996,1995,1994,1993,1992,1991,1990,1989,1988,1987,1986,1985,1984,1983,1982,1981
This statistics in other country:
AfghanistanAlbaniaAlgeriaAngolaAntigua and BarbudaArgentinaArmeniaArubaAustraliaAustriaAzerbaijanBahamas, TheBahrainBangladeshBarbadosBelarusBelgiumBelizeBeninBermudaBhutanBoliviaBosnia and HerzegovinaBotswanaBrazilBrunei DarussalamBulgariaBurkina FasoBurundiCabo VerdeCambodiaCameroonCanadaCentral African RepublicChadChileChinaColombiaComorosCongo, Dem. Rep.Congo, Rep.Costa RicaCote d'IvoireCroatiaCubaCyprusCzech RepublicDenmarkDjiboutiDominicaDominican RepublicEcuadorEgypt, Arab Rep.El SalvadorEquatorial GuineaEritreaEstoniaEthiopiaFaroe IslandsFijiFinlandFranceFrench PolynesiaGabonGambia, TheGeorgiaGermanyGhanaGreeceGrenadaGuatemalaGuineaGuinea-BissauGuyanaHaitiHondurasHong Kong SAR, ChinaHungaryIcelandIndiaIndonesiaIran, Islamic Rep.IraqIrelandIsraelItalyJamaicaJapanJordanKazakhstanKenyaKiribatiKorea, Rep.KosovoKuwaitKyrgyz RepublicLao PDRLatviaLebanonLesothoLiberiaLibyaLithuaniaLuxembourgMacao SAR, ChinaMacedonia, FYRMadagascarMalawiMalaysiaMaldivesMaliMaltaMauritaniaMauritiusMexicoMicronesia, Fed. Sts.MoldovaMongoliaMontenegroMoroccoMozambiqueMyanmarNamibiaNepalNetherlandsNew CaledoniaNew ZealandNicaraguaNigerNigeriaNorwayOmanPakistanPalauPanamaPapua New GuineaParaguayPeruPhilippinesPolandPortugalPuerto RicoQatarRomaniaRussian FederationRwandaSamoaSaudi ArabiaSenegalSerbiaSeychellesSierra LeoneSingaporeSlovak RepublicSloveniaSolomon IslandsSomaliaSouth AfricaSouth SudanSpainSri LankaSt. Kitts and NevisSt. LuciaSt. Vincent and the GrenadinesSudanSurinameSwazilandSwedenSwitzerlandSyrian Arab RepublicTajikistanTanzaniaThailandTimor-LesteTogoTongaTrinidad and TobagoTunisiaTurkeyTurkmenistanUgandaUkraineUnited Arab EmiratesUnited KingdomUnited StatesUruguayUzbekistanVanuatuVenezuela, RBVietnamWest Bank and GazaYemen, Rep.ZambiaZimbabwe Timeline:
This timeline shows a graph from 1981 to 2015 of Comoros. No data until 1980. Number of actual observations by date: 35.
Source name:
World Development Indicators
Source organization:
World Bank national accounts data, and OECD National Accounts data files.
Categories, topics:
Economy & Growth
Last updated:
apr 23, 2017
Indicators value changes by year
Minimum:
13.554 bln
jan 1, 1981
Maximum:
144.827 bln
jan 1, 2015
At the date of observation
Value
Absolute change
Change from previous value
jan 1, 1981
13.554 bln
+13.554 bln
0.0%
jan 1, 1982
15.281 bln
+1.727 bln
12.74%
jan 1, 1983
18.946 bln
+3.665 bln
23.98%
jan 1, 1984
22.813 bln
+3.867 bln
20.41%
jan 1, 1985
26.084 bln
+3.271 bln
14.34%
jan 1, 1986
25.748 bln
-335.999 mln
-1.29%
jan 1, 1987
23.348 bln
-2.4 bln
-9.32%
jan 1, 1988
25.09 bln
+1.742 bln
7.46%
jan 1, 1989
25.813 bln
+722.999 mln
2.88%
jan 1, 1990
24.908 bln
-905.001 mln
-3.51%
jan 1, 1991
25.287 bln
+379.001 mln
1.52%
jan 1, 1992
26.604 bln
+1.317 bln
5.21%
jan 1, 1993
29.487 bln
+2.883 bln
10.84%
jan 1, 1994
28.145 bln
-1.342 bln
-4.55%
jan 1, 1995
36.547 bln
+8.402 bln
29.85%
jan 1, 1996
38.689 bln
+2.142 bln
5.86%
jan 1, 1997
36.594 bln
-2.095 bln
-5.41%
jan 1, 1998
39.946 bln
+3.352 bln
9.16%
jan 1, 1999
35.507 bln
-4.439 bln
-11.11%
jan 1, 2000
34.857 bln
-650.0 mln
-1.83%
jan 1, 2001
30.598 bln
-4.259 bln
-12.22%
jan 1, 2002
35.724 bln
+5.126 bln
16.75%
jan 1, 2003
36.326 bln
+602.2 mln
1.69%
jan 1, 2004
44.114 bln
+7.788 bln
21.44%
jan 1, 2005
47.352 bln
+3.238 bln
7.34%
jan 1, 2006
54.744 bln
+7.392 bln
15.61%
jan 1, 2007
61.048 bln
+6.304 bln
11.52%
jan 1, 2008
68.781 bln
+7.733 bln
12.67%
jan 1, 2009
85.752 bln
+16.971 bln
24.67%
jan 1, 2010
89.816 bln
+4.064 bln
4.74%
jan 1, 2011
101.837 bln
+12.021 bln
13.38%
jan 1, 2012
108.384 bln
+6.546 bln
6.43%
jan 1, 2013
123.1 bln
+14.716 bln
13.58%
jan 1, 2014
137.2 bln
+14.101 bln
11.45%
jan 1, 2015
144.827 bln
+7.627 bln
5.56%
Ranking of countries by current statistics by years


Comments: