29
/
en
AIzaSyAYiBZKx7MnpbEhh9jyipgxe19OcubqV5w
April 1, 2024
219172
Panama
PAN
true
2
1
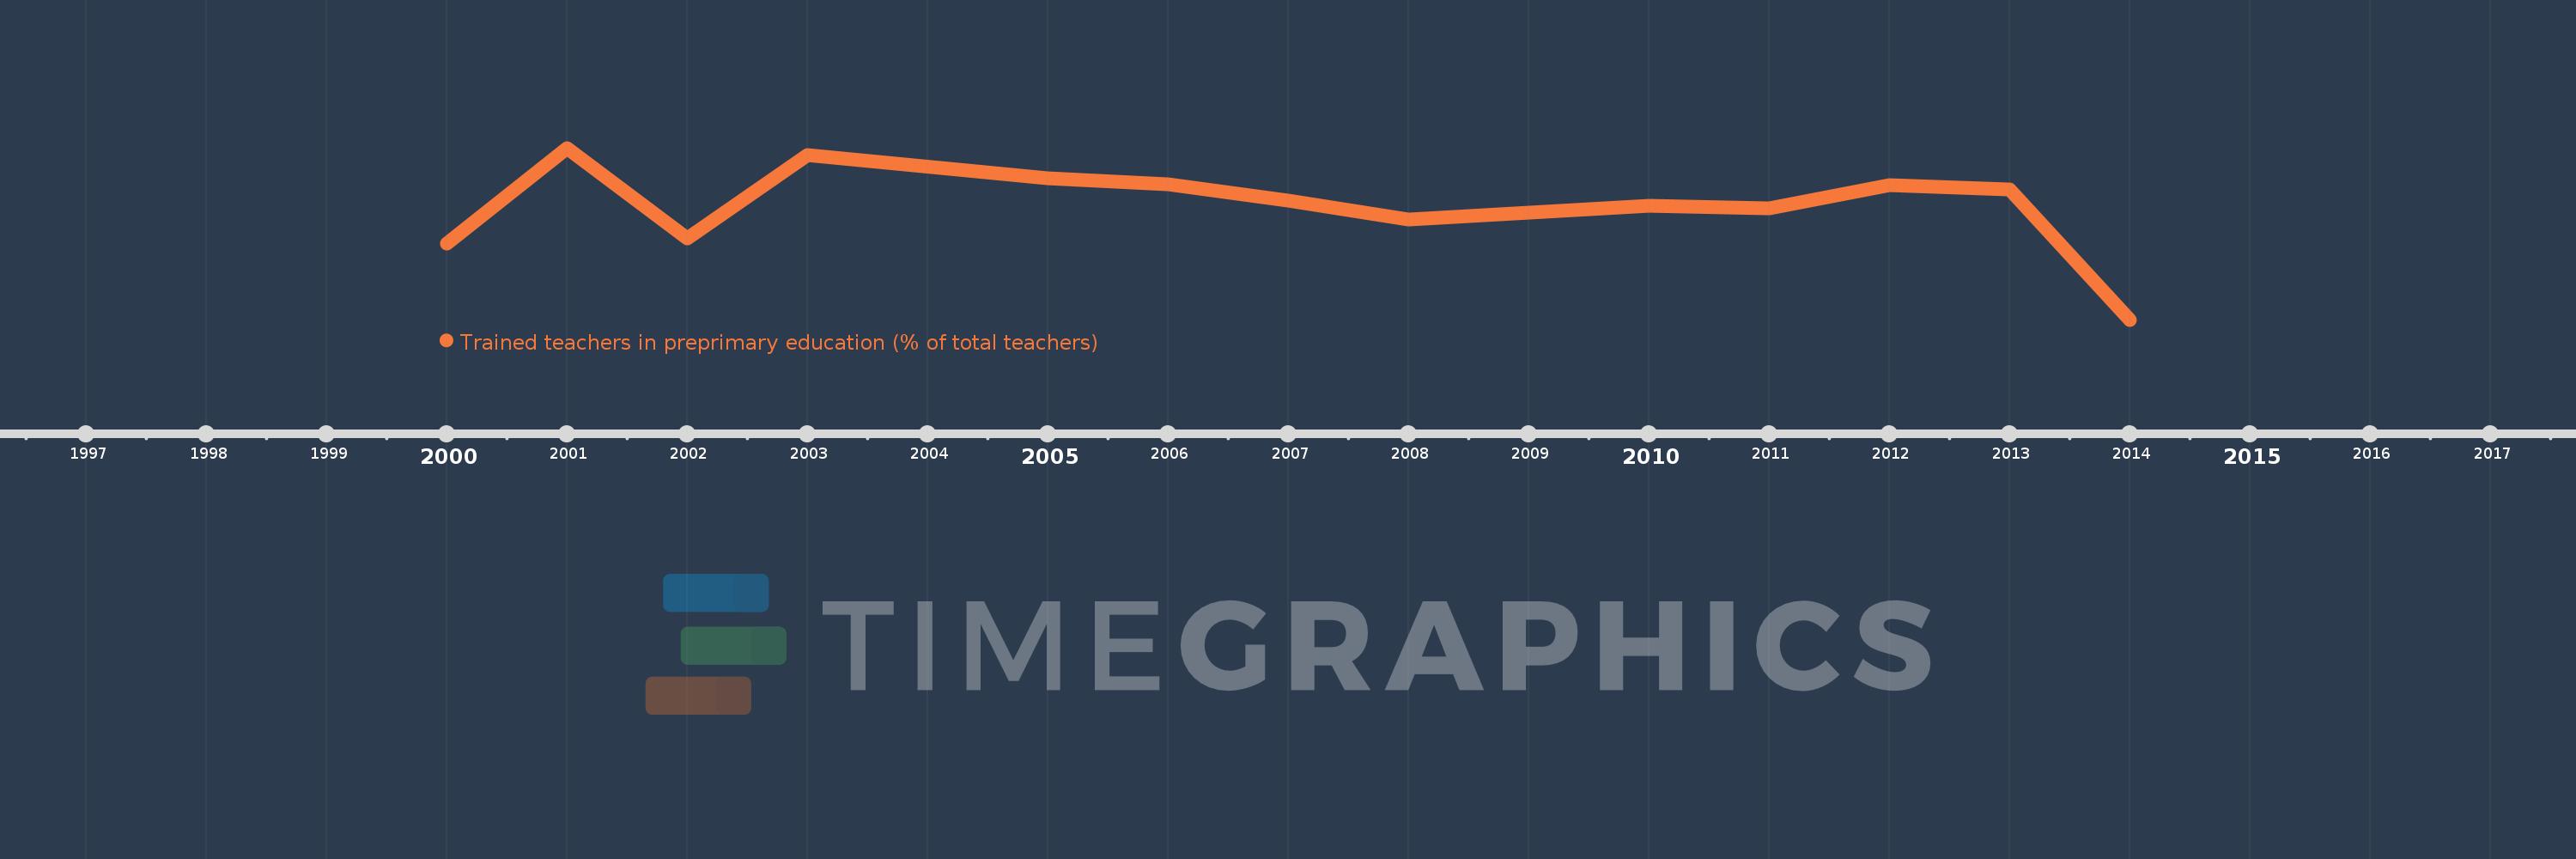
Trained teachers in preprimary education (% of total teachers)
2014,2013,2012,2011,2010,2009,2008,2007,2006,2005,2003,2002,2001,2000
This statistics in other country:
Timeline:
This timeline shows a graph from 2000 to 2014 of Panama. No data until 1999. Number of actual observations by date: 14.
Source name:
World Development Indicators
Source organization:
United Nations Educational, Scientific, and Cultural Organization (UNESCO) Institute for Statistics.
Categories, topics:
Education
Last updated:
apr 23, 2017
Indicators value changes by year
Minimum:
21.462
jan 1, 2014
At the date of observation
Value
Absolute change
Change from previous value
jan 1, 2000
36.413
+36.413
0.0%
jan 1, 2001
55.03
+18.617
51.13%
jan 1, 2002
37.392
-17.639
-32.05%
jan 1, 2003
53.676
+16.285
43.55%
jan 1, 2005
49.184
-4.492
-8.37%
jan 1, 2006
48.001
-1.183
-2.41%
jan 1, 2007
44.687
-3.314
-6.9%
jan 1, 2008
40.987
-3.7
-8.28%
jan 1, 2009
42.446
+1.459
3.56%
jan 1, 2010
43.705
+1.26
2.97%
jan 1, 2011
43.287
-0.418
-0.96%
jan 1, 2012
47.788
+4.501
10.4%
jan 1, 2013
46.948
-0.84
-1.76%
jan 1, 2014
21.462
-25.485
-54.28%
Ranking of countries by current statistics by years


Comments: