29
/
en
AIzaSyAYiBZKx7MnpbEhh9jyipgxe19OcubqV5w
April 1, 2024
61258
Sub-Saharan Africa (IDA & IBRD countries)
TSS
false
2
1
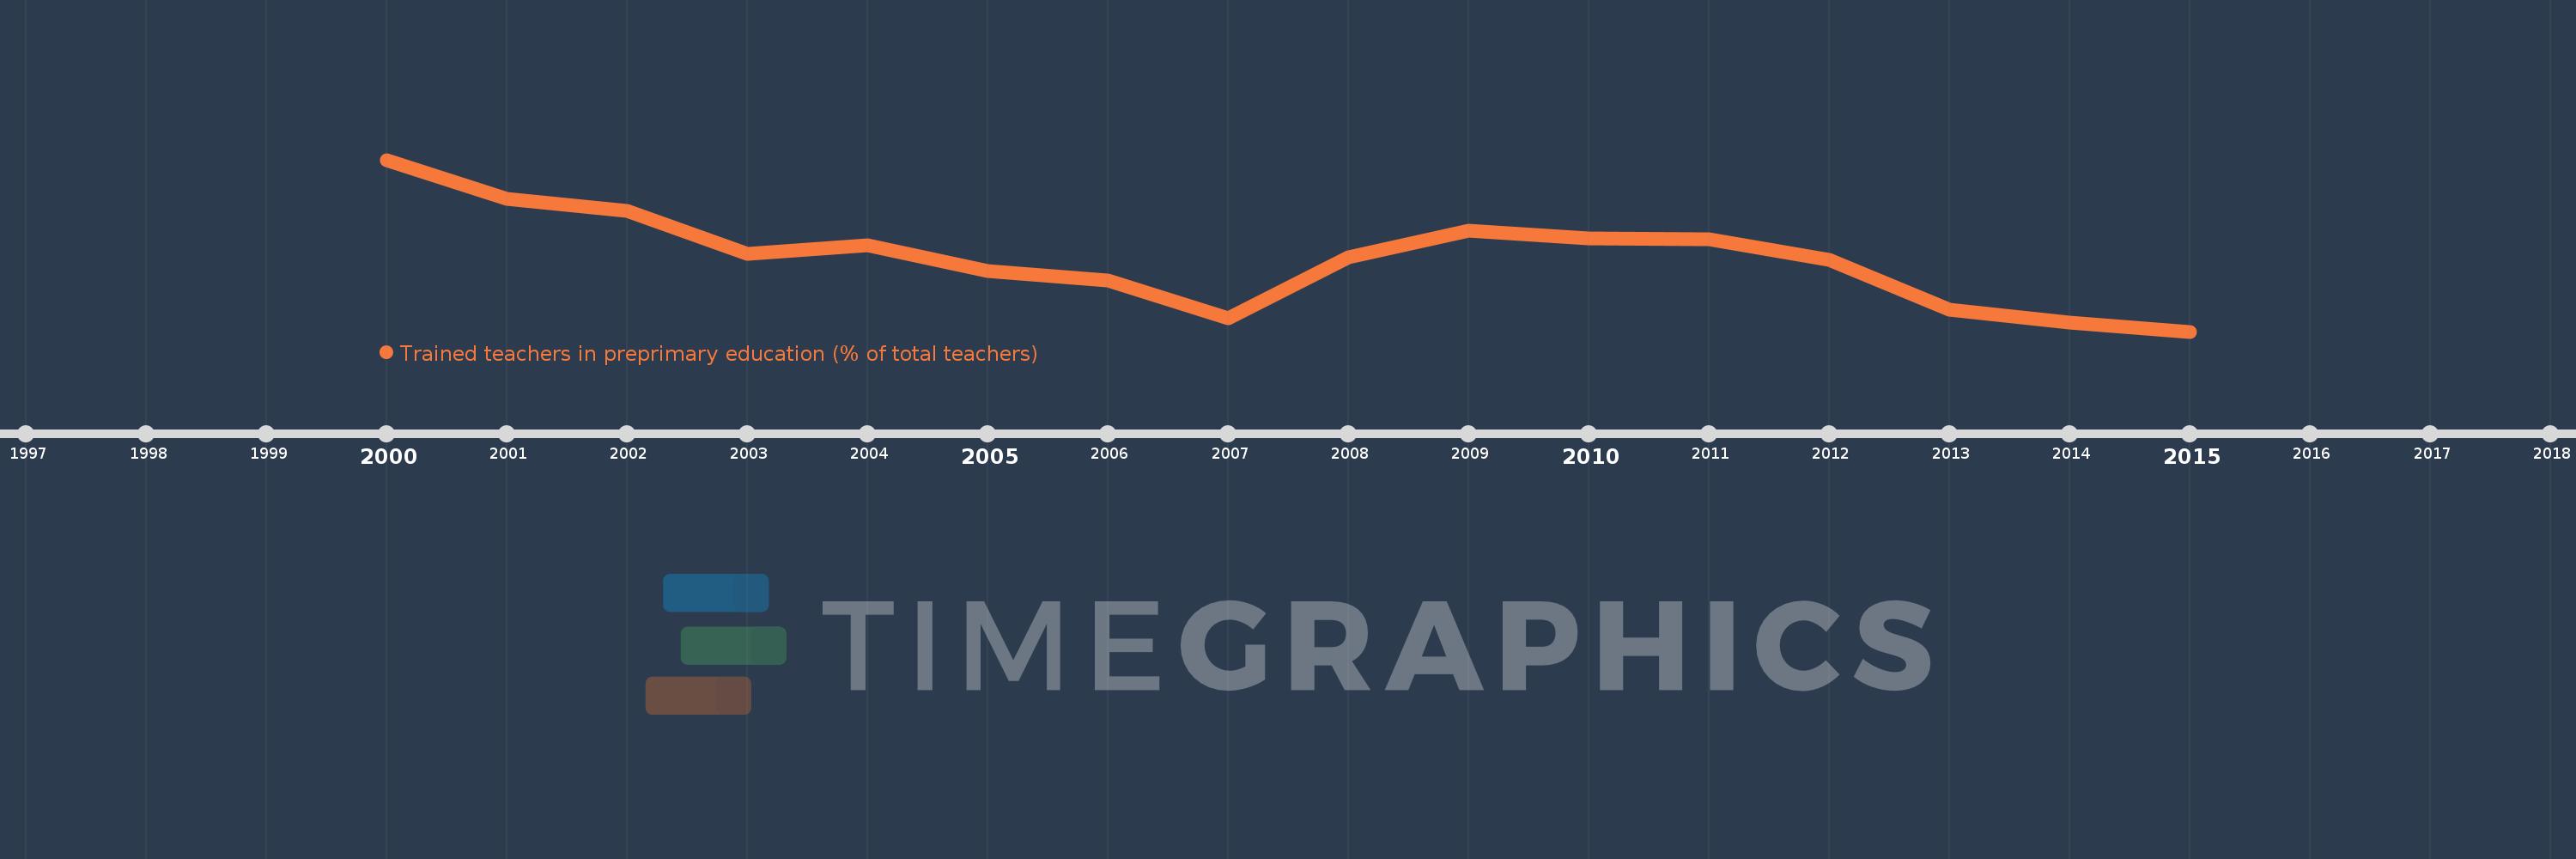
Trained teachers in preprimary education (% of total teachers)
2015,2014,2013,2012,2011,2010,2009,2008,2007,2006,2005,2004,2003,2002,2001,2000
This statistics in other country:
Timeline:
This timeline shows a graph from 2000 to 2015 of Sub-Saharan Africa (IDA & IBRD countries). No data until 1999. Number of actual observations by date: 16.
Source name:
World Development Indicators
Source organization:
United Nations Educational, Scientific, and Cultural Organization (UNESCO) Institute for Statistics.
Categories, topics:
Education
Last updated:
apr 23, 2017
Indicators value changes by year
Minimum:
45.664
jan 1, 2015
At the date of observation
Value
Absolute change
Change from previous value
jan 1, 2000
60.75
+60.75
0.0%
jan 1, 2001
57.305
-3.445
-5.67%
jan 1, 2002
56.225
-1.079
-1.88%
jan 1, 2003
52.488
-3.737
-6.65%
jan 1, 2004
53.233
+0.745
1.42%
jan 1, 2005
50.978
-2.256
-4.24%
jan 1, 2006
50.125
-0.852
-1.67%
jan 1, 2007
46.801
-3.324
-6.63%
jan 1, 2008
52.164
+5.363
11.46%
jan 1, 2009
54.519
+2.356
4.52%
jan 1, 2010
53.878
-0.641
-1.18%
jan 1, 2011
53.736
-0.142
-0.26%
jan 1, 2012
51.933
-1.803
-3.36%
jan 1, 2013
47.604
-4.329
-8.34%
jan 1, 2014
46.427
-1.176
-2.47%
jan 1, 2015
45.664
-0.764
-1.64%
Ranking of countries by current statistics by years


Comments: