29
/
en
AIzaSyAYiBZKx7MnpbEhh9jyipgxe19OcubqV5w
April 1, 2024
141229
Ghana
GHA
true
2
1
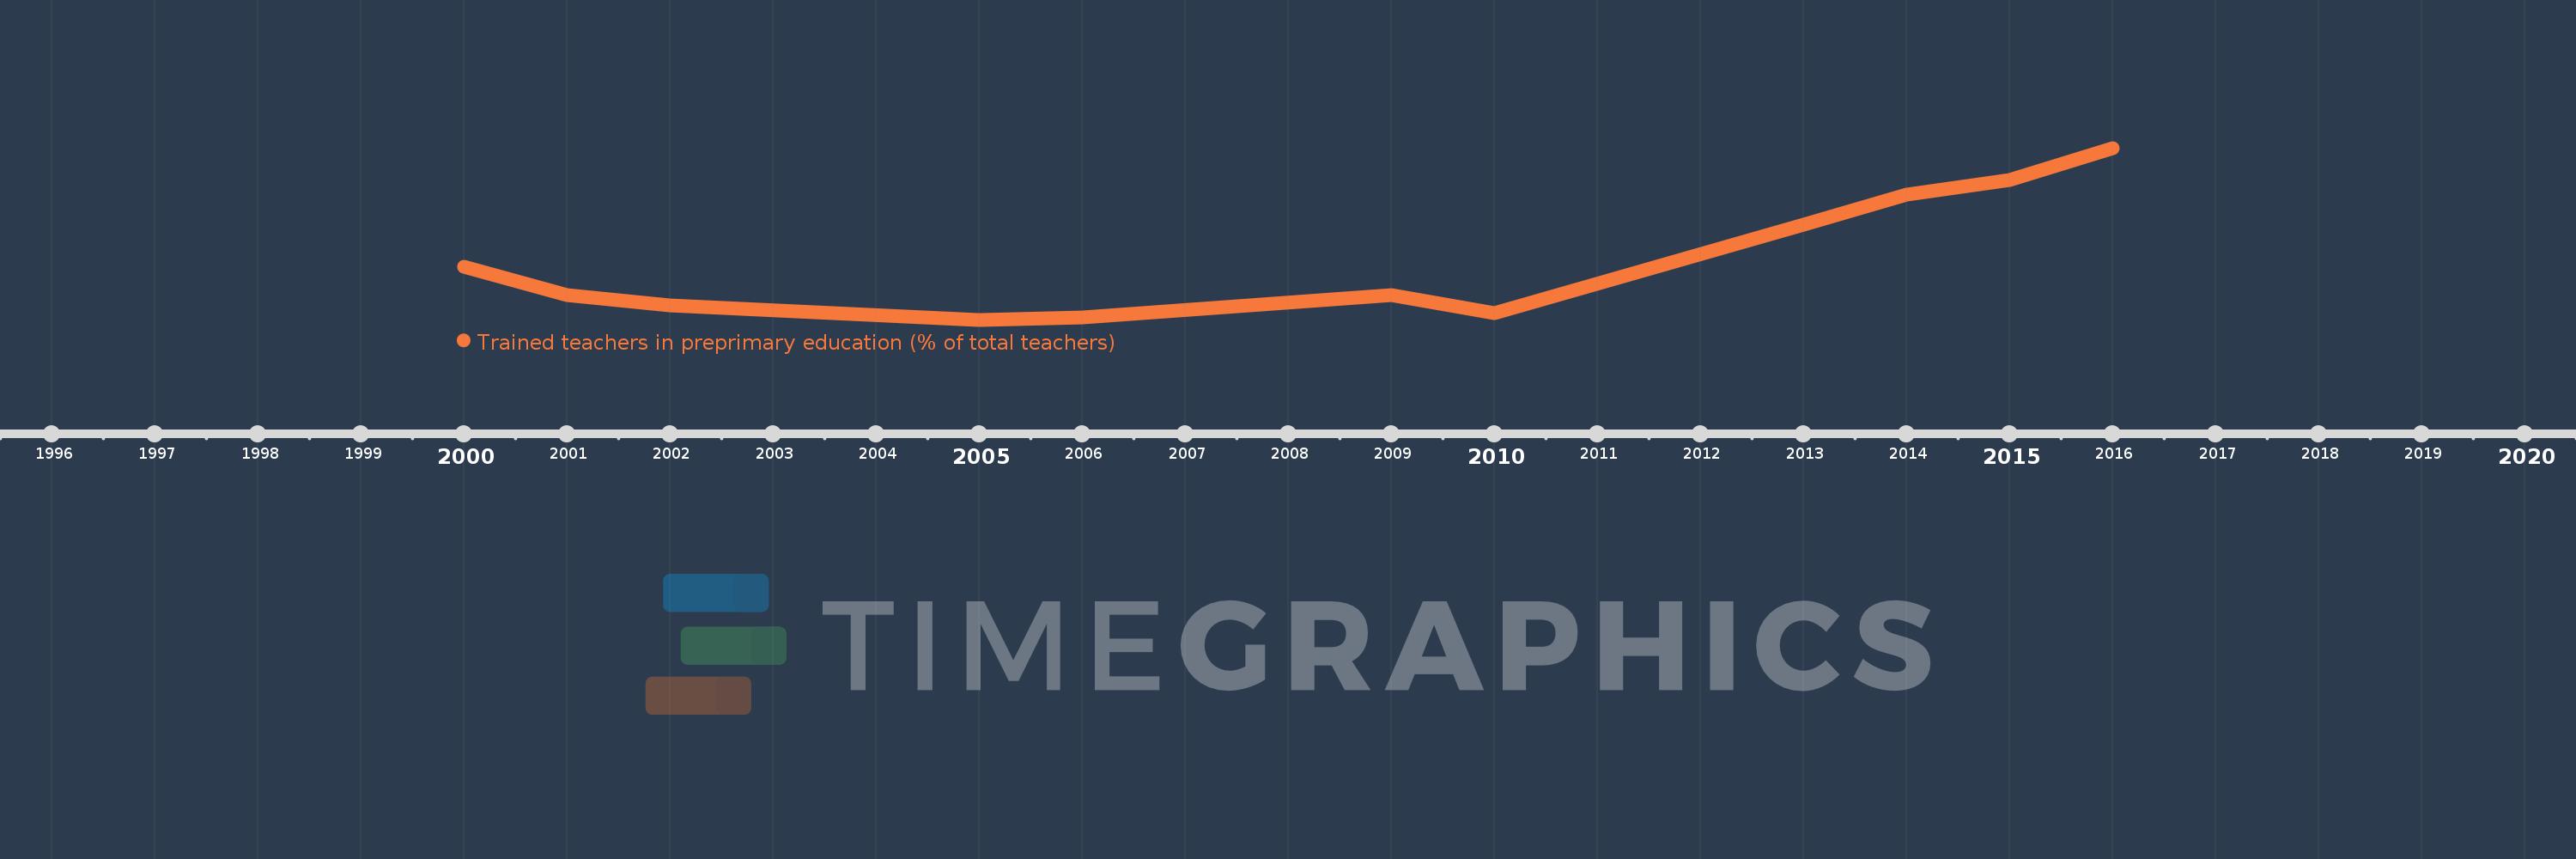
Trained teachers in preprimary education (% of total teachers)
2016,2015,2014,2013,2010,2009,2006,2005,2002,2001,2000
This statistics in other country:
Timeline:
This timeline shows a graph from 2000 to 2016 of Ghana. No data until 1999. Number of actual observations by date: 11.
Source name:
World Development Indicators
Source organization:
United Nations Educational, Scientific, and Cultural Organization (UNESCO) Institute for Statistics.
Categories, topics:
Education
Last updated:
apr 23, 2017
Indicators value changes by year
Minimum:
21.955
jan 1, 2005
Maximum:
45.548
jan 1, 2016
At the date of observation
Value
Absolute change
Change from previous value
jan 1, 2000
29.192
+29.192
0.0%
jan 1, 2001
25.39
-3.802
-13.02%
jan 1, 2002
23.94
-1.45
-5.71%
jan 1, 2005
21.955
-1.985
-8.29%
jan 1, 2006
22.229
+0.274
1.25%
jan 1, 2009
25.341
+3.112
14.0%
jan 1, 2010
22.89
-2.451
-9.67%
jan 1, 2013
35.052
+12.162
53.13%
jan 1, 2014
39.142
+4.09
11.67%
jan 1, 2015
41.161
+2.019
5.16%
jan 1, 2016
45.548
+4.387
10.66%
Ranking of countries by current statistics by years


Comments: