29
/
en
AIzaSyAYiBZKx7MnpbEhh9jyipgxe19OcubqV5w
April 1, 2024
81354
Belarus
BLR
true
2
1
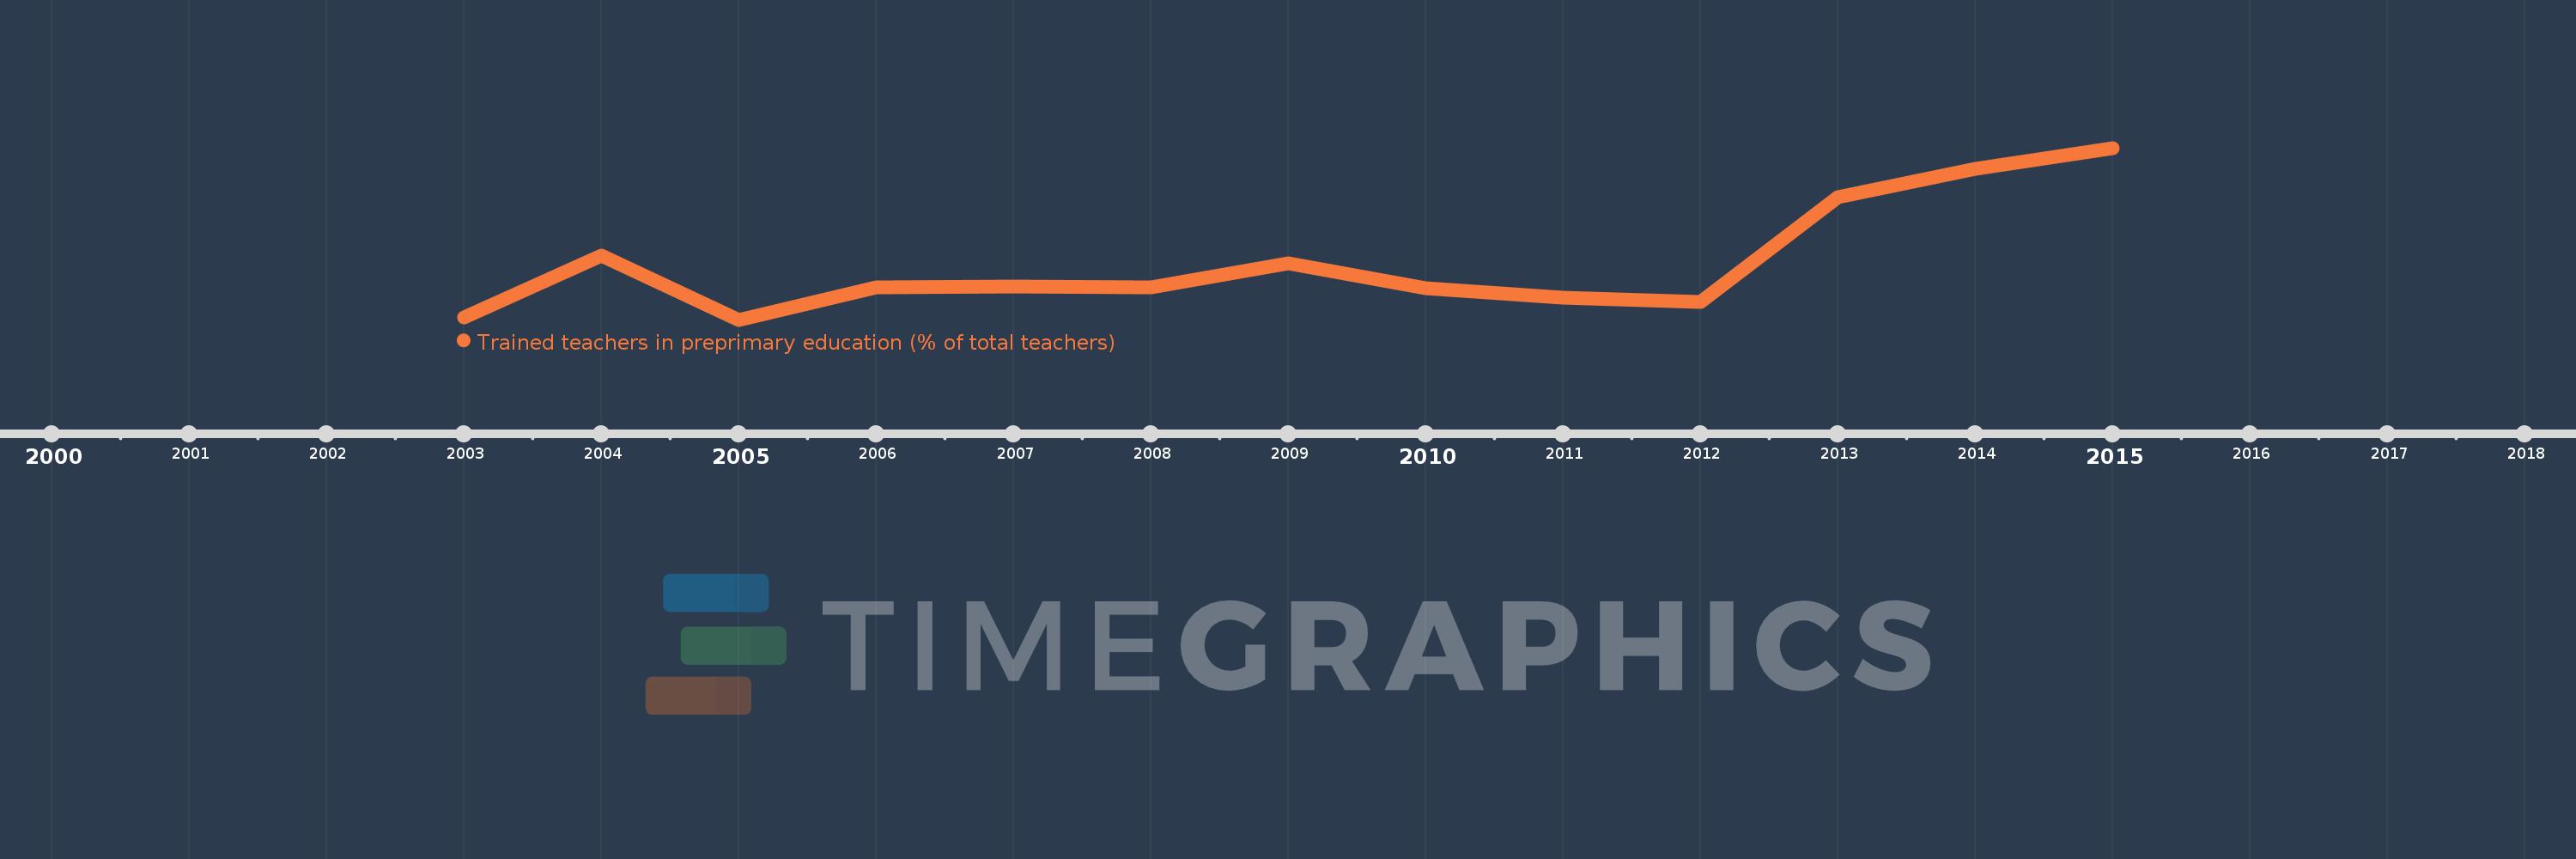
Trained teachers in preprimary education (% of total teachers)
2015,2014,2013,2012,2011,2010,2009,2008,2007,2006,2005,2004,2003
This statistics in other country:
Timeline:
This timeline shows a graph from 2003 to 2015 of Belarus. No data until 2002. Number of actual observations by date: 13.
Source name:
World Development Indicators
Source organization:
United Nations Educational, Scientific, and Cultural Organization (UNESCO) Institute for Statistics.
Categories, topics:
Education
Last updated:
apr 23, 2017
Indicators value changes by year
Minimum:
57.868
jan 1, 2005
Maximum:
92.115
jan 1, 2015
At the date of observation
Value
Absolute change
Change from previous value
jan 1, 2003
58.331
+58.331
0.0%
jan 1, 2004
70.578
+12.247
21.0%
jan 1, 2005
57.868
-12.71
-18.01%
jan 1, 2006
64.379
+6.511
11.25%
jan 1, 2007
64.536
+0.157
0.24%
jan 1, 2008
64.24
-0.295
-0.46%
jan 1, 2009
69.192
+4.952
7.71%
jan 1, 2010
64.153
-5.04
-7.28%
jan 1, 2011
62.285
-1.868
-2.91%
jan 1, 2012
61.46
-0.825
-1.32%
jan 1, 2013
82.386
+20.926
34.05%
jan 1, 2014
88.032
+5.645
6.85%
jan 1, 2015
92.115
+4.083
4.64%
Ranking of countries by current statistics by years


Comments: