29
/
en
AIzaSyAYiBZKx7MnpbEhh9jyipgxe19OcubqV5w
April 1, 2024
148691
Guyana
GUY
true
2
1
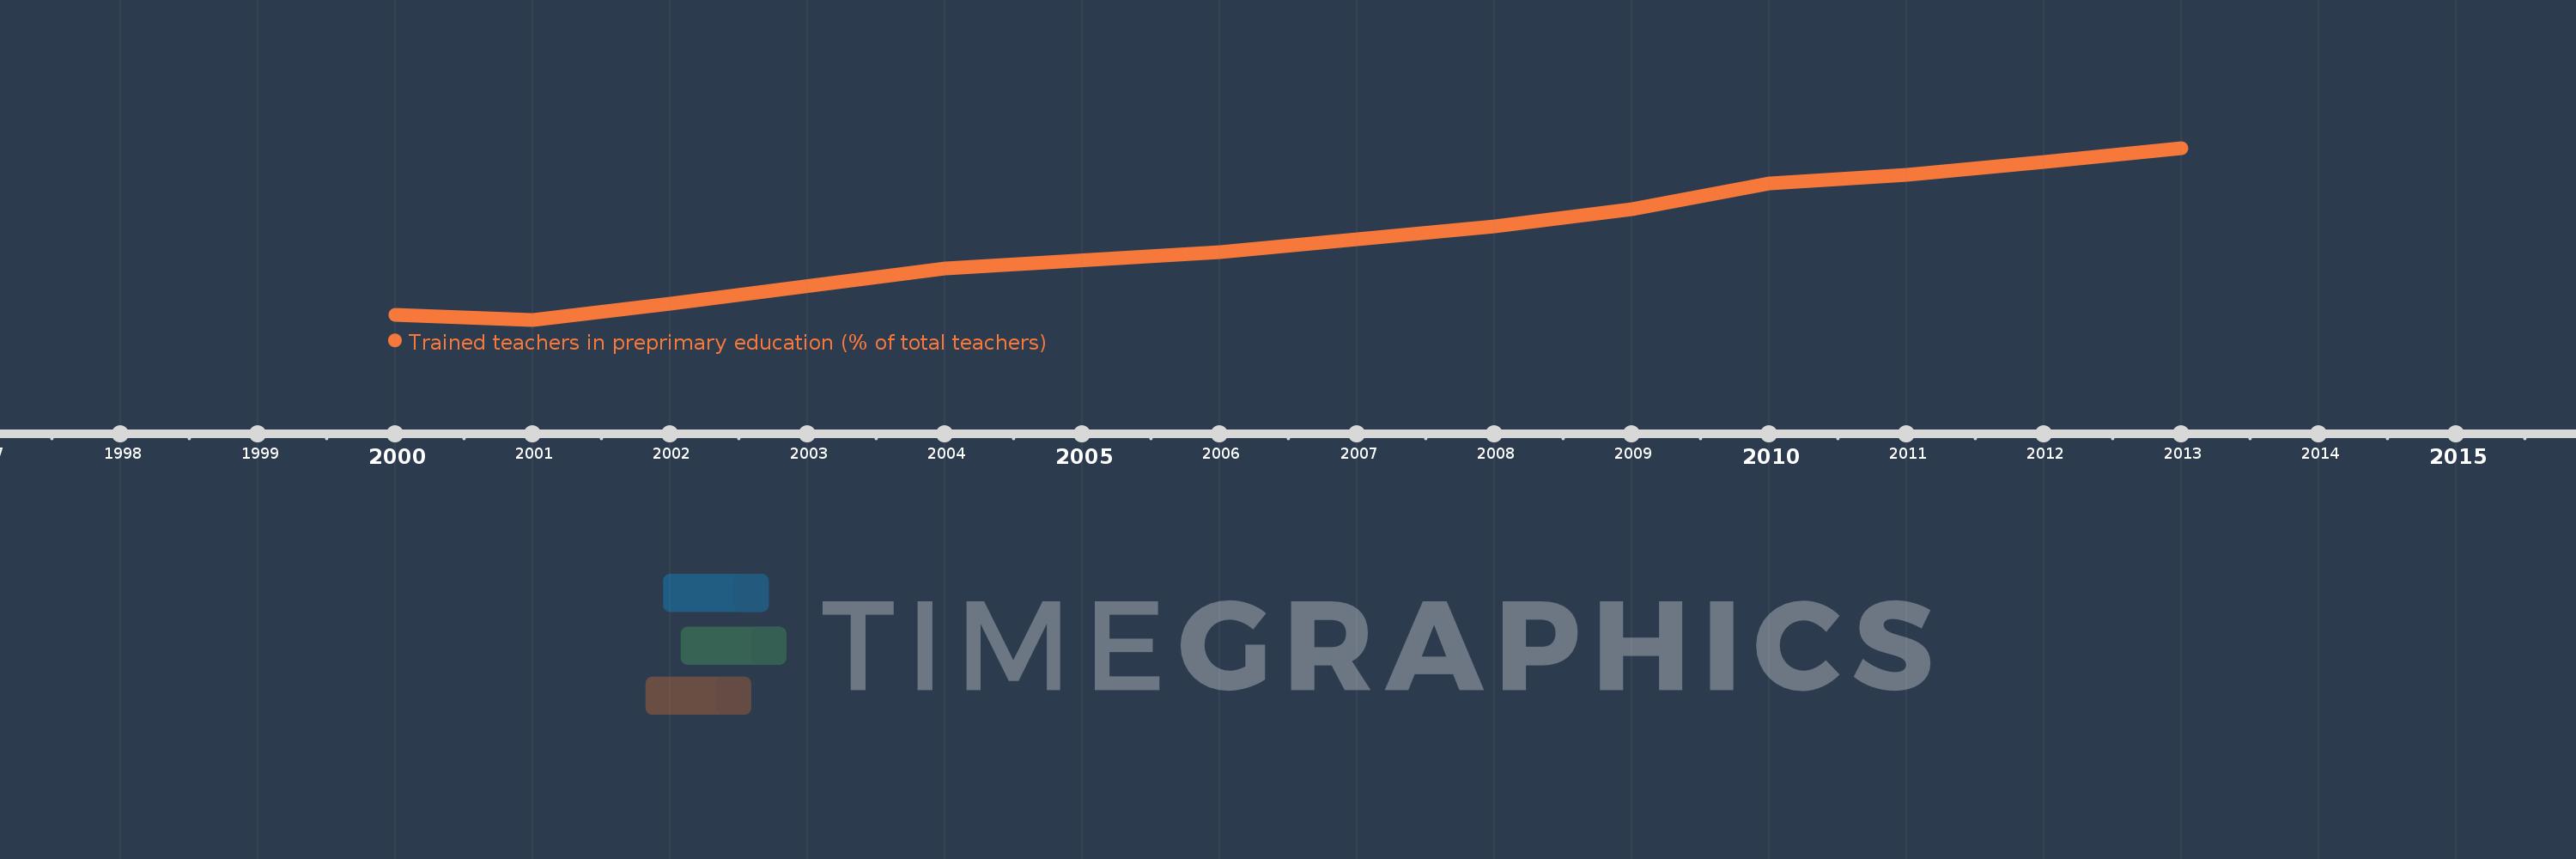
Trained teachers in preprimary education (% of total teachers)
2013,2012,2011,2010,2009,2008,2006,2004,2002,2001,2000
This statistics in other country:
Timeline:
This timeline shows a graph from 2000 to 2013 of Guyana. No data until 1999. Number of actual observations by date: 11.
Source name:
World Development Indicators
Source organization:
United Nations Educational, Scientific, and Cultural Organization (UNESCO) Institute for Statistics.
Categories, topics:
Education
Last updated:
apr 23, 2017
Indicators value changes by year
Minimum:
37.579
jan 1, 2001
Maximum:
65.171
jan 1, 2013
At the date of observation
Value
Absolute change
Change from previous value
jan 1, 2000
38.355
+38.355
0.0%
jan 1, 2001
37.579
-0.776
-2.02%
jan 1, 2002
40.108
+2.529
6.73%
jan 1, 2004
45.865
+5.757
14.35%
jan 1, 2006
48.425
+2.56
5.58%
jan 1, 2008
52.536
+4.111
8.49%
jan 1, 2009
55.342
+2.806
5.34%
jan 1, 2010
59.431
+4.088
7.39%
jan 1, 2011
60.85
+1.42
2.39%
jan 1, 2012
62.935
+2.085
3.43%
jan 1, 2013
65.171
+2.236
3.55%
Ranking of countries by current statistics by years


Comments: